Table of contents
- Reach, Engagement, Conversion - the cornerstones of social media analysis
- Which tools are suitable for analyzing social media KPIs?
- Five key social media metrics for your KPI cockpit
- Growth rate - The growth indicator for your channels
- 2. Frequency - Like replacement for TikTok and Insta Stories
- 3. Applause Rate - Measuring the volume of likes
- 4. Saves/Bookmarks – Insights for the entire marketing team
- 5. Bounce Rate – The quality seal for website traffic
Followers, Impressions, Likes - the supposedly most important social media KPIs are quickly mentioned. However, there are a number of metrics that are often overlooked in the KPI cockpits of many marketers - although they can provide completely new insights for your own marketing. Manfred Rump from
House of Yas explains how you can get even more out of your social media analysis and shows you five game changer metrics for your marketing measures.
Recommended social media software
On our comparison platform OMR Reviews you can find more recommended social media software.
We present over 100 solutions that are perfectly tailored to the needs of SMEs, start-ups and large corporations. Our platform supports you in all areas of social media management. Take the opportunity to compare different software and consult real user reviews to find the ideal solution for your requirements:
There are certain metrics that should not be missing in any KPI analysis because they provide basic insights into your social media activities. Your basic setup should therefore always include the following metrics along the funnel stages Reach, Engagement and Conversion:
You can't do without tools for KPI analysis. You can use the following, for example:
Taken alone, these KPIs are rather weak in terms of their informational value and are therefore also called "vanity metrics" (German: vanity, emptiness). Only in combination do they unfold their true strength, as you will see now!
Growth rate - The growth indicator for your channels
Because the number of internet users worldwide is still growing, follower growth on social media channels is also expected. Although the pure increase in the number of followers on your own social media channels is nice to look at. However, this metric alone is not very meaningful. Instead, marketers should also take a look at the growth rate. It is calculated as follows:
 What insights does the growth rate provide for social media?
The growth rate indicates the speed at which you are collecting new followers on social media. So you find out how fast your channels are growing during a chosen period of time. The exciting thing about this metric: It makes you comparable with the competition and reveals the growth rate of your own and any competitor channels. So you can estimate whether you are currently on catch-up or how close the competition is on your heels. The growth rate also makes campaign performances over a certain period (e.g. Christmas, Black Friday, market entries etc.) comparable and assessable.
Tip: You can find out the growth rate for you and your competitors using free tools such as Socialblade.
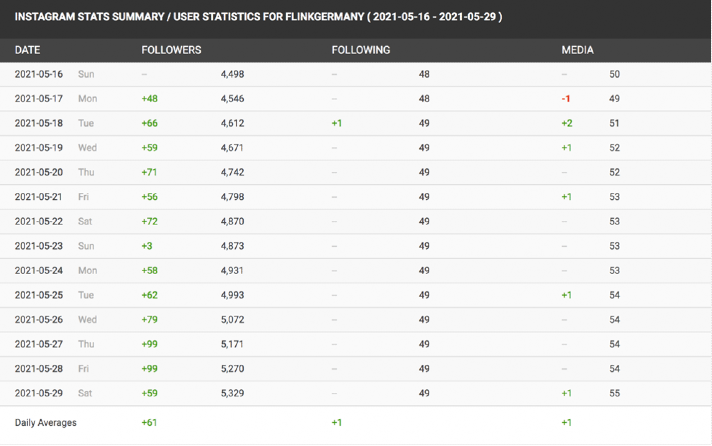
Example: Gorillas vs. Flink
Gorillas has more followers on Instagram than the young competitor Flink. Both delivery services' channels were able to record a daily increase in follower numbers in the second half of May.
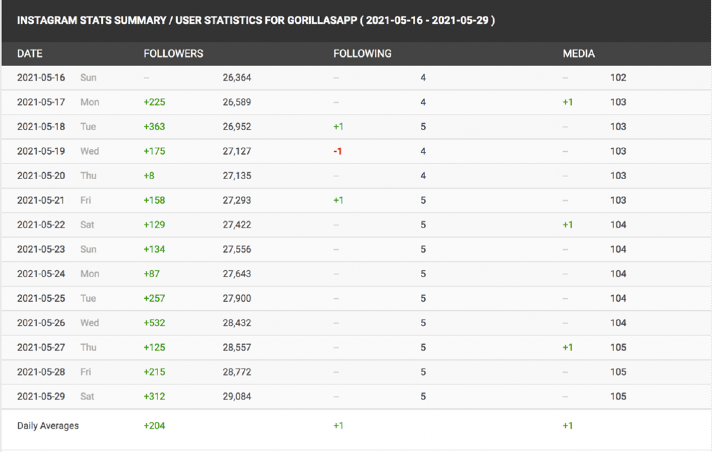
Source: socialblade.com
Source: socialblade.com
If we base the data between May 16 and May 29, 2021, divide the net winnings of the channels (
@gorillasapp: 2,720;
@flinkgermany: 831) by the total number of followers (@gorillasapp: 29,084; @flinkgermany: 5,329) and multiply these values by 100, a differentiated picture emerges:
The growth rate currently sees Flink at almost 16 percent compared to Gorillas with over 9 percent, slightly ahead. Flink is currently growing faster than its competitor and is catching up in terms of Instagram followers.
2. Frequency - Like replacement for TikTok and Insta Stories
Frequency is largely regarded as an important currency in paid marketing, because it indicates how often a person averages sees a particular content. Performance marketers can thus check the frequency in order to ensure that they reach social media users well dosed with their advertisements.
The formula is as follows:
 What insights does frequency give for social media?
Especially in the current arenas of social media, TikTok and Instagram Stories, "Likes" play a marginal or no role. Given the fast-paced nature of TikTok or the short lifespan of Stories, impressions - or better yet: repeated impressions - are already considered a quality seal for content. This is where frequency comes into play: It is a measure of the intensity of content. In the context of TikTok and Instagram Stories, reach (here: number of accounts reached) and impressions (here: number of appearances) typically go hand in hand. The same content at least generates many impressions as it does reach.
But if the impressions exceed the reach, it indicates an increased effect of the post: Users consume the content more than once - and willingly so. While increased frequency is a warning signal for marketers, it is equivalent to a knighthood in organic social media marketing.
Example:
The TikTok post with 107.5k views and a reach of 101,299 has a frequency of 1.06. The second post, despite fewer views (79.3k), has a higher frequency of 1.08: It was seen more frequently by the people reached.
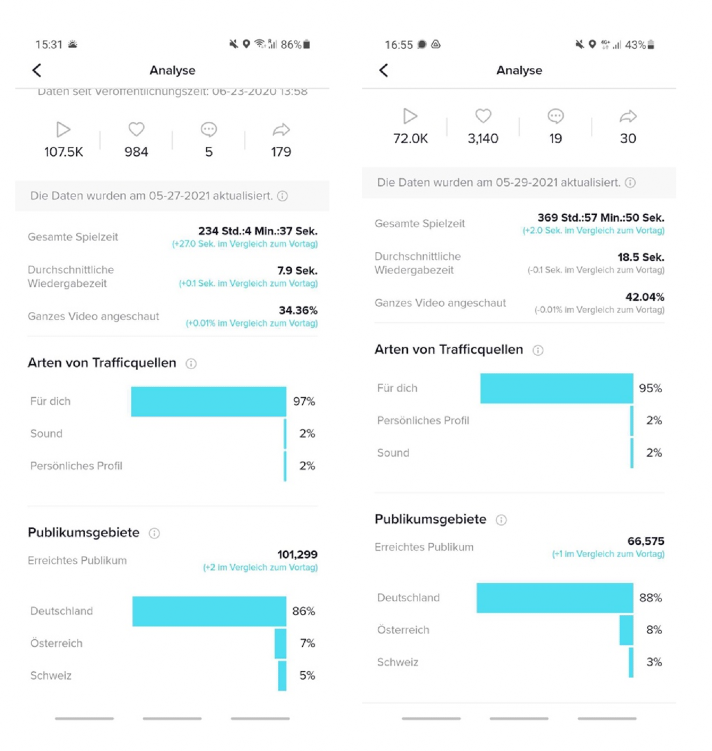
Source: Own screenshot; @houseofyas_de
Especially when the meaningfulness of "Like" indications is doubtful or likes as a measurement value are omitted, the frequency can thus contain detailed insights for your own social media strategy.
3. Applause Rate - Measuring the volume of likes
Likes are considered digital applause and are a popular indicator of the popularity of social media posts. The more, the better - but this metric only gains true significance in relation to the size of the audience. What portion of followers are giving a like? Or in other words: How loud is the applause compared to the size of the audience?
The applause rate is calculated as follows:
 What insights does the applause rate provide for social media?
The applause rate puts the number of likes in relation to the number of followers. It protects you from drawing false conclusions and prevents you from viewing like numbers or follower numbers in isolation.
Only a lively community is a good community. This metric ensures that your content resonates with your audience.
Examples:
• If the follower base is constantly growing, this is initially positive. If the average number of likes remains the same over the course of the posts during the same period, you need to rethink your strategy. It looks like you are addressing your loyal fans, but your content may not be getting new followers.
• The applause rate also works in the other direction: If followers are leaving, but your likes remain constant or increase, this speaks for a strong follower bond and a high brand or audience fit.
Note: In order to increase the meaningfulness of further "vanity KPIs" in the engagement area, you can and should regularly relate them to reach KPIs in the same schema, e.g.:
• Comment Conversion Rate = (Comments / Followers) * 100
• Amplification Rate = (Shares / Followers) * 100
• Engagement Rate = ((Likes + Shares + Comments) / Followers) * 100
4. Saves/Bookmarks – Insights for the entire marketing team
In many social networks, posts can not only be shared, commented on or given a reaction, but also saved. Even if the number of saves/bookmarks is not publicly displayed and may therefore be less prestigious than likes, you should definitely have this metric on the KPI radar.
Because: It allows deep insights into your own content strategy - beyond social media!
What insights do Saves/Bookmarks provide for social media?
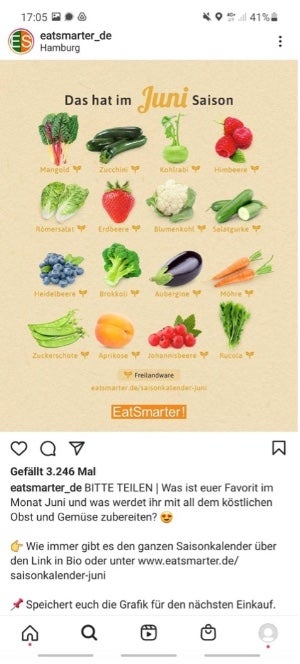
The recipe publisher Eatsmarter deliberately posts posts that lend themselves to saving/bookmarking. Source: @eatsmarter_de
But the Save/Bookmark metric is attractive for another reason: Users particularly frequently save comprehensive, useful evergreen content, such as cooking recipes, sports exercises and other guides and tips. This somehow sounds like, exactly: SEO!
Analogous to the search volume, the save metric could also be called a "find volume". It indicates how many users have found a permanently useful content with a post.
Thanks to the Save/Bookmark metric, these social media contents can be used as test balloons for planned SEO or long form content. This KPI is thus generating insights for your entire marketing team.
Is your SEO department currently planning new magazine topics or is the lead gen team pondering over the next webinar or whitepaper topic? The Save/Bookmark metric may be able to expedite the research process!
5. Bounce Rate – The quality seal for website traffic
The bounce rate indicates the percentage of people who come as traffic to your page and leave it immediately without performing an action.
This key figure does not necessarily signal that the content of the page is insufficient per se. In any case, a high bounce rate is an indicator that people were directed to a page with certain expectations that the content did not meet.
The bounce rate is calculated as follows:
 What insights does the bounce rate provide for social media?
In the context of social media, the bounce rate is suitable for ascertaining the follow-up ability of social media posts to the web content. Unlike the conversion rate, which can only measure the proportion of people who have clicked on a link in the post, the bounce rate says something about the quality of the link or the call to action (CTA).
A low bounce rate, for example, indicates that you have placed the links in tweets, Facebook posts, etc. sensibly and that the linked content is relevant to the social media users. High bounce rates, on the other hand, signal: The linked content does not match the social media post and addresses a wrong audience.
The bounce rate is ideal as a benchmark for traffic from different social media channels. Through
Google Analytics you can quickly find out which platform is particularly suitable as a traffic source - and which social media campaigns generate comparatively little website traffic.
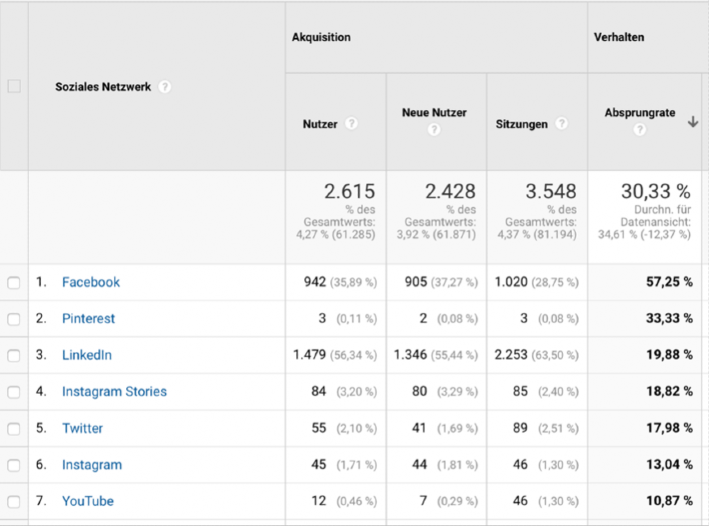
Source: Own screenshot
Conclusion: The perfect social media cockpit mixes KPI classics with relevant ratio metrics
To achieve the targeted goals in the areas of reach, engagement or conversion, you should of course always consider the classic, obvious key figures.
However, it only becomes really insightful when you relate the different KPIs to each other. Only then do you get meaningful values and ensure comparability, both in terms of your posts, channels and competitors!
The list of KPIs presented helps with this, but of course it is far from complete. On the contrary! It should rather encourage you to rescue even more, less obvious key figures from their shadowy existence and integrate them into your KPI analysis.
In conclusion, three central learnings on the way to the ideal KPI setup for social media:
1. The relevance and meaningfulness of social media KPIs is constantly changing (see e.g. missing likes on Instagram stories) and should therefore always be questioned.
2. Sustainable positive or negative developments can only be read from the combination of different KPIs (also across funnel stages).
3. Your social media insights can always be relevant for other departments as well.