These are the 7 Best Business Intelligence Tools
Katharina Iken1/30/2026
We present to you the best and most popular business intelligence tools and explain what these tools can do.
Table of contents
- What does business intelligence mean?
- Why is business intelligence important?
- Why do companies need a business intelligence tool?
- What are typical functions of business intelligence systems?
- These are the top 7 BI tools on OMR Reviews
- 1. Tracify
- Microsoft Power BI refers to a unified, scalable platform for self-service and business intelligence, which is primarily aimed at corporations. With the help of the tool, the gap between data and decision-making should be closed. With
- is a software for managing and visualizing mass data. With this tool, all data from the other Google tools can be collected and analyzed. The data from Google Analytics, Google Ads, sheets and other Google tools can than be processed with Looker Studio so that metrics, reports and visualizations, evaluations can be created.
- is designed for e-commerce businesses with 10 to 100 employees who need to sell multiple products and retain their customers in order to make a profit. Users receive all insights from different data sources they need for their growth – centralized and easily customizable to reflect reality.
- You can collaborate with your team members at any time, ask your own questions and build live stories that can be discovered by others. Tableau can extract large amounts of data and, using modern database and computer graphics technology, vast data sets can also be analyzed on your laptop.
- In addition, the software also enables intuitive data access, so that all employees can independently access the data. On- and offline data sources can be summarized to realize a holistic business view. The advanced cloud technology and the pre-made DWH enable a high-performance data processing.
- These are the main features of Looker:
- on OMR Reviews. In total, we have listed over 20 BI tools there, with which you can visualize and understand your data. So stop by and compare the software using authentic and verified user reviews.
- Therefore, invest in a solution that is not only compatible with a wide range of data sources, but also designs the visualization and data analysis seamlessly and user-friendly. In doing so, you give your company a clear advantage in the fast-paced business world by making data-driven decisions faster and more informed. Remember: The best business intelligence solution is the one that seamlessly integrates into your existing processes and complements them with powerful, automated features.
Data, data and even more data. When it comes to the importance of data for businesses and the corresponding relevance of evaluation, business intelligence software comes into the conversation. Because business intelligence tools can support you in your data management and significantly simplify it. But the market for BI tools is large and the tool selection is sometimes not that easy. If you're looking for a business intelligence tool, but are not quite sure which tool best suits your needs and requirements, you're in the right place. We present you with the most popular and best business intelligence solutions according to OMR reviews.
What does business intelligence mean?
Business Intelligence (BI) is a collective or generic term for the various sub-areas of business analytics, data mining, data infrastructure, data visualization and also data tools. So, in summary, BI covers all processes from the collection, storage, presentation to the evaluation of company data. The goal of business intelligence is that you work data-driven and can make decisions based on data. Business Intelligence provides you with company data from all your business areas, so that you can increase the efficiency of your company based on this and react to changes in the market.
Recommended Business-Intelligence-Tools
You can find more recommended business intelligence tools on our comparison platform OMR Reviews. There we have over 130 BI tools for small and medium-sized enterprises, start-ups and large corporations to help you better understand your data. So take a look and compare the software with the help of authentic and verified user reviews:
Why is business intelligence important?
Business Intelligence is essential when it comes to optimizing business processes and setting up successfully for the future. For example, you can increase productivity in your company. Also, BI can also support you in achieving certain goals by regularly checking whether you are on the right path. In the long term, the use of Business Intelligence is also expected to have a positive impact on your ROI (Return-on-Investment). With Business Intelligence, you are able to identify, evaluate data and finally react to it.
Why do companies need a business intelligence tool?
Data in a company can be very diverse and confusing. A BI tool can support you in collecting, centrally storing and clearly preparing this data from internal and external sources in dashboards, reports and other data visualizations. These results are then provided to both the decision-makers and the operational employees of a company using a business intelligence tool. With a business intelligence solution, you can improve and accelerate decision-making processes in your company.
These are the advantages of business intelligence solutions:
As already mentioned, business intelligence tools bring some advantages. The most important advantages of BI software are:
- Optimization of business processes
- Making data-driven business decisions
- Provision of automated reporting based on real-time data
- Accelerating response time to changes
- Improving operational efficiency
- Increasing the ROI
- Reducing technical hurdles for data integration
- Consistent data situation and central data storage
What are typical functions of business intelligence systems?
To meet the multifaceted requirements of modern companies, BI systems offer a range of functions designed to effectively collect, analyze and present data. Here are some of the typical functions found in most business intelligence systems:
- Reporting and data analysis: This is the heart of every BI system. With advanced analysis tools, companies can examine large amounts of data to identify trends, measure performance, and gain operational and strategic insight. Reporting functions make it possible to present these analyses in easy-to-understand reports that can be made available to decision-makers.
- Data collection from internal systems and external sources: A powerful BI system integrates data from a variety of sources. Whether it is internal data from CRM and ERP systems or external data from market research and social media - BI tools can bring all this information together to provide a comprehensive view of the business landscape.
- Central data storage: To ensure the integrity and security of the data, BI systems store all collected information in a central location. This central data storage not only facilitates access and management of data, but also improves the efficiency of data processing and analysis.
- Data visualization and dashboards: Visualizations are crucial to make complex data accessible and understandable. BI tools offer dynamic dashboards that allow users to visualize data in real-time. These dashboards can be individually adapted to monitor specific metrics that are relevant to various users or departments within the company.
- Data modeling: BI systems allow you to create data models that define the relationships between different data sets. These models are crucial for conducting complex analyses that help to gain deeper insights into the data. Data modeling also supports the simulation of various scenarios to foresee the impact of potential business decisions.
These are the top 7 BI tools on OMR Reviews
These are the seven most popular business intelligence tools based on verified reviews and experiences from the OMR community:
What the individual BI tools can do, we'll show you now. More helpful information and user reviews of the various business intelligence systems can be found on OMR Reviews in the Business Intelligence category.
1. Tracify
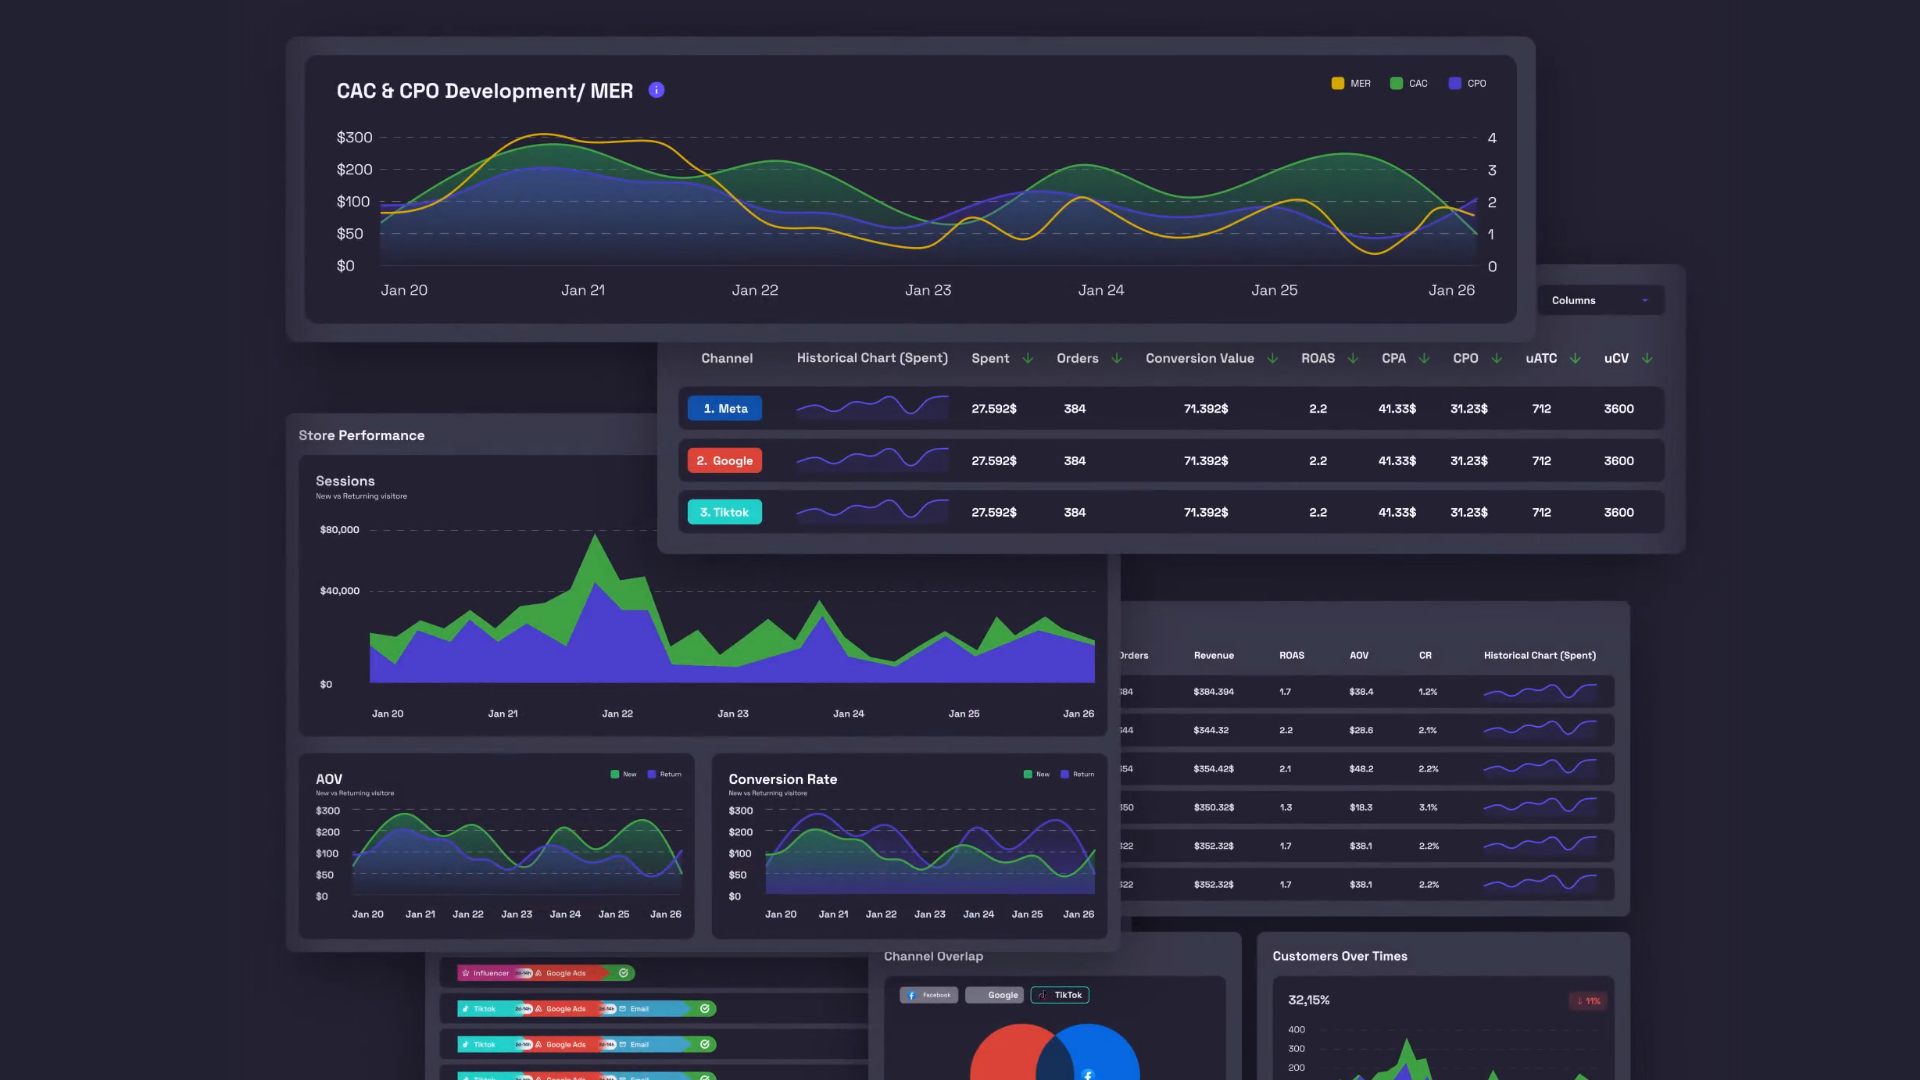
Tracify is a software for e-commerce companies for the tracking and attribution of all marketing activities (multichannel). With the help of a revolutionary tracking technology, users can be tracked without cookies, modeling or Google Analytics – GDPR compliant with Tracify.
Tracify Features
These are the main features of Tracify:
- Multichannel tracking and attribution: With Tracify, campaigns and creatives can be traced across channels according to the journey. In addition, the tracking problem caused by the IOS14 update can be better solved, as more data is available again to make decisions.
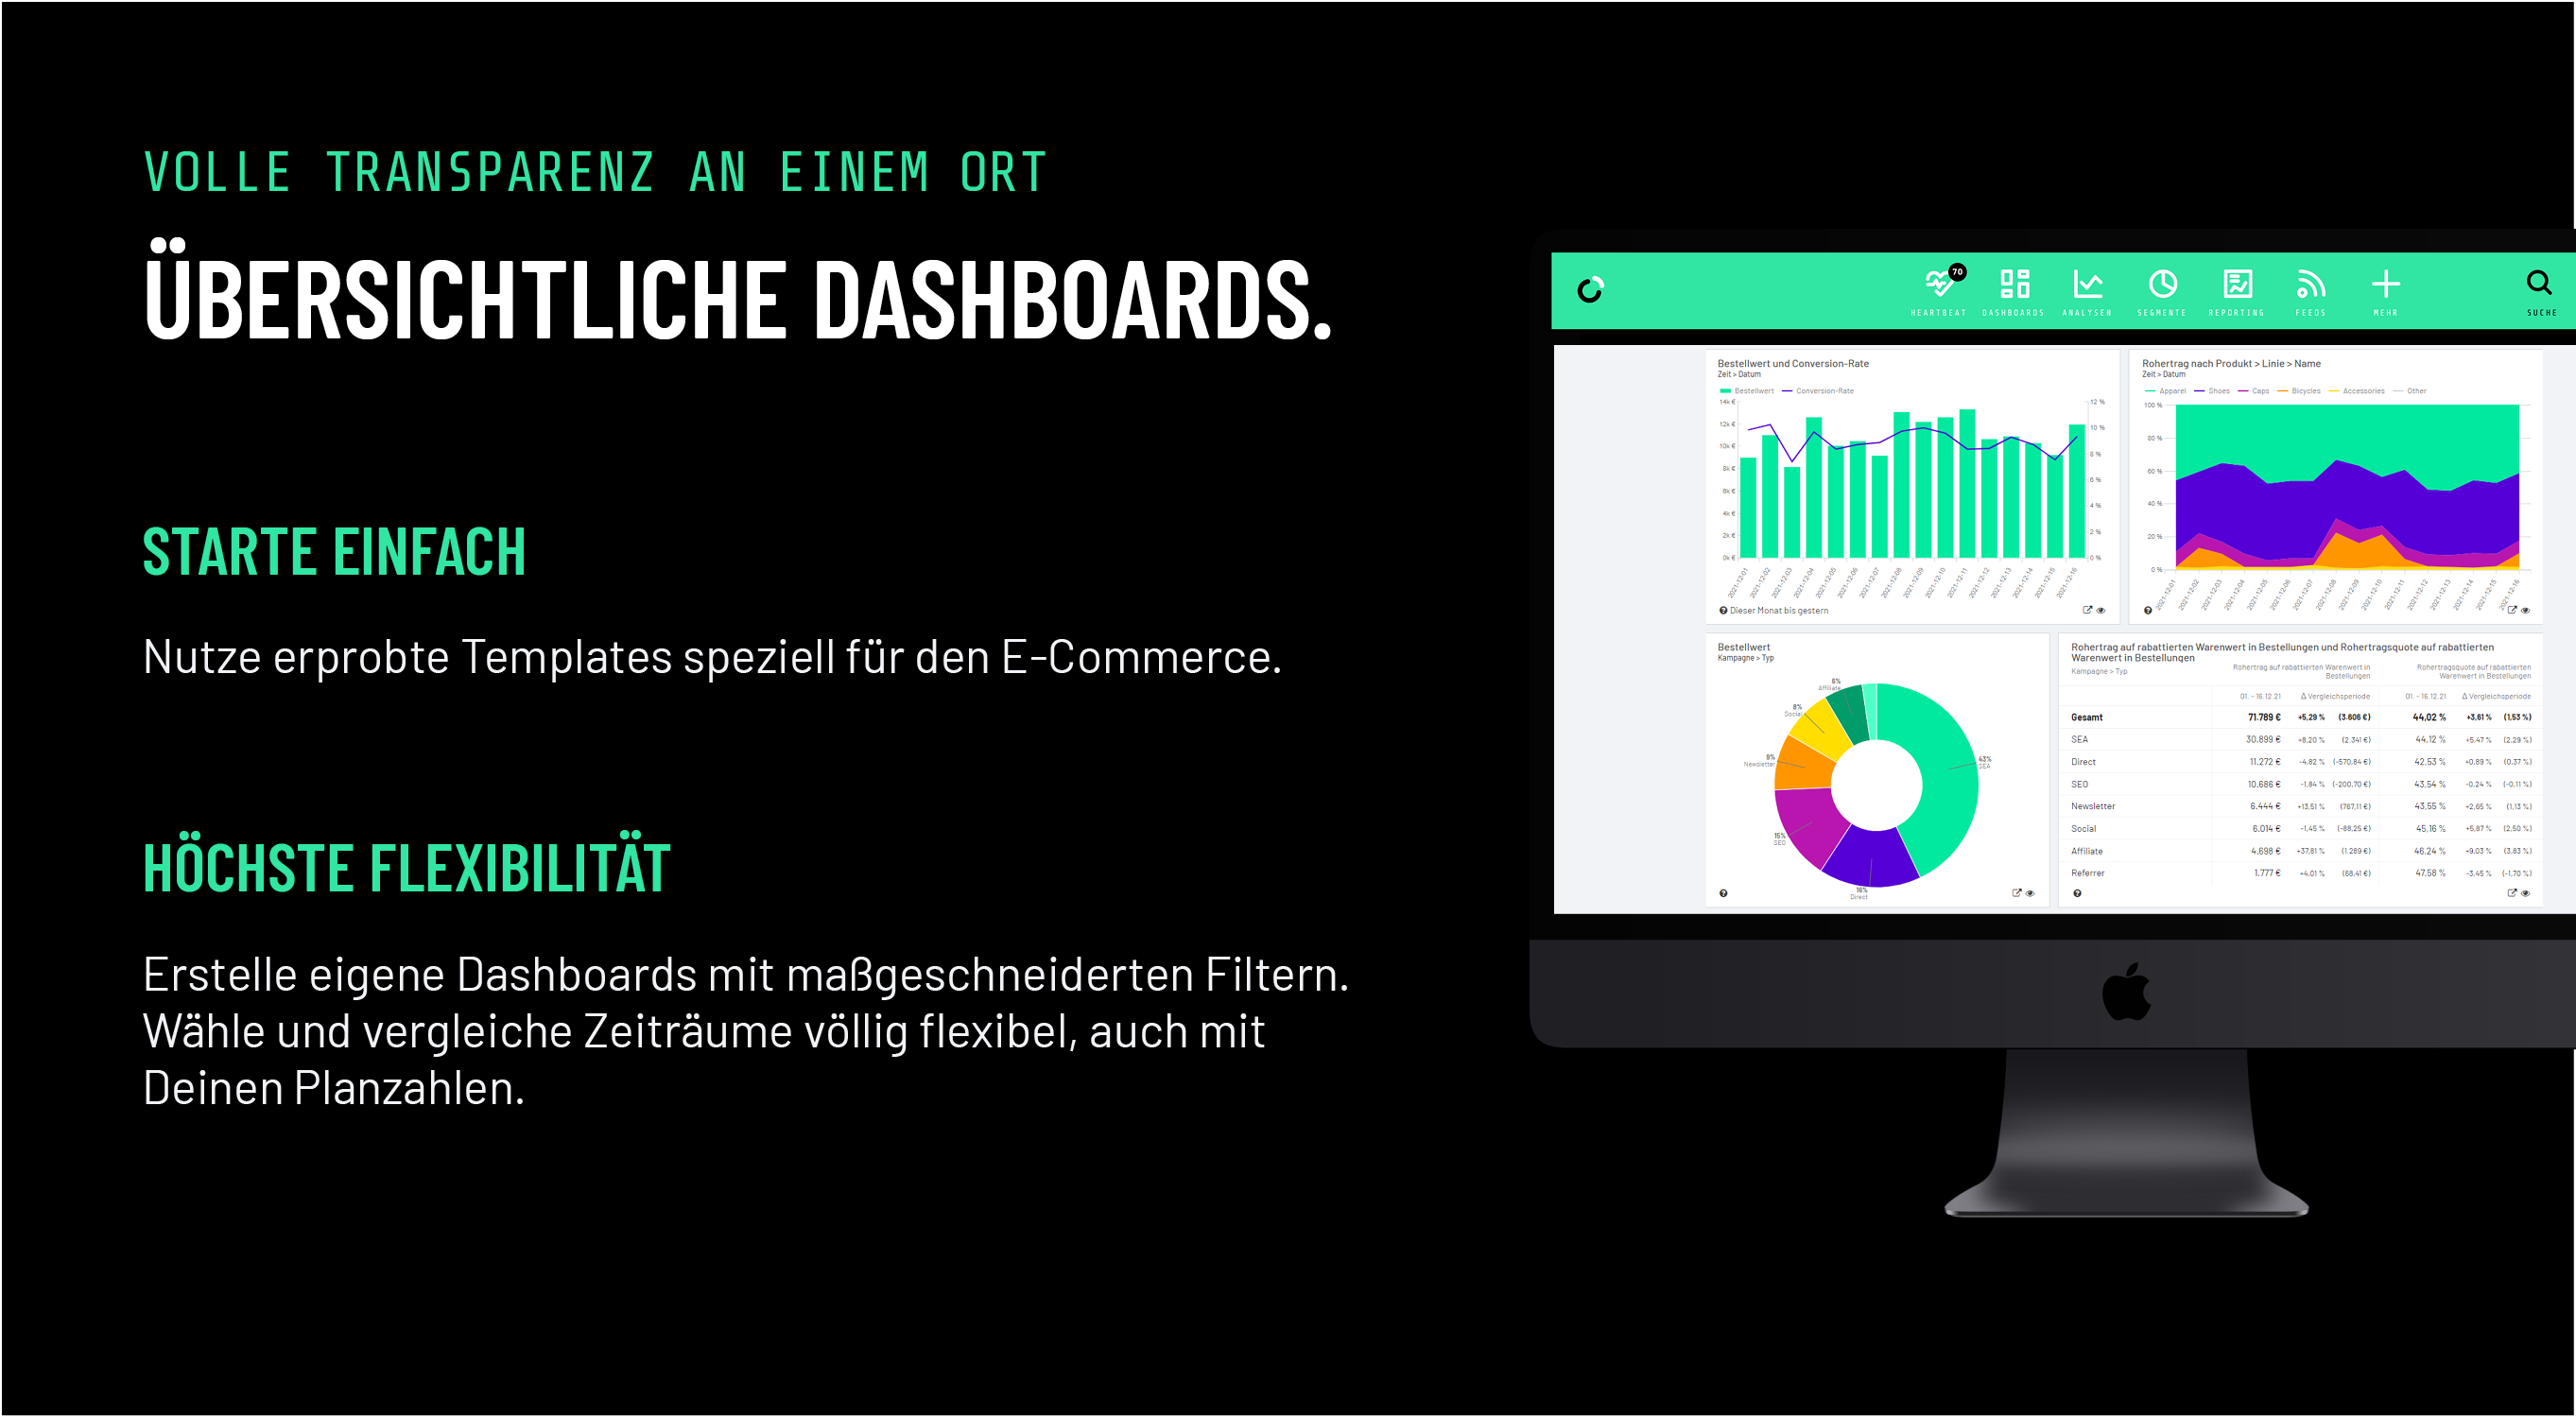
- Reportings & Dashboards: Tracify offers a variety of detailed dashboards, which provide different insights into the performance of individual channels (meta, TikTok, Google, influencer), as well as bringing all these channels together holistically, as well as transparently displaying the customer journey.
Tracify Costs
The Pricing of Tracify is based on the amount of monthly multichannel budget. Prices start from €500 per month and a one-time set-up fee of €500. A demo version is also available through the provider's website.
Tracify Alternatives
You are looking for an alternative to Tracify and can't decide which tool best suits your requirements? Then check out OMR Reviews! There you can find a large selection of BI tools and choose a suitable tool for you based on real user reviews.2. Microsoft Power BI
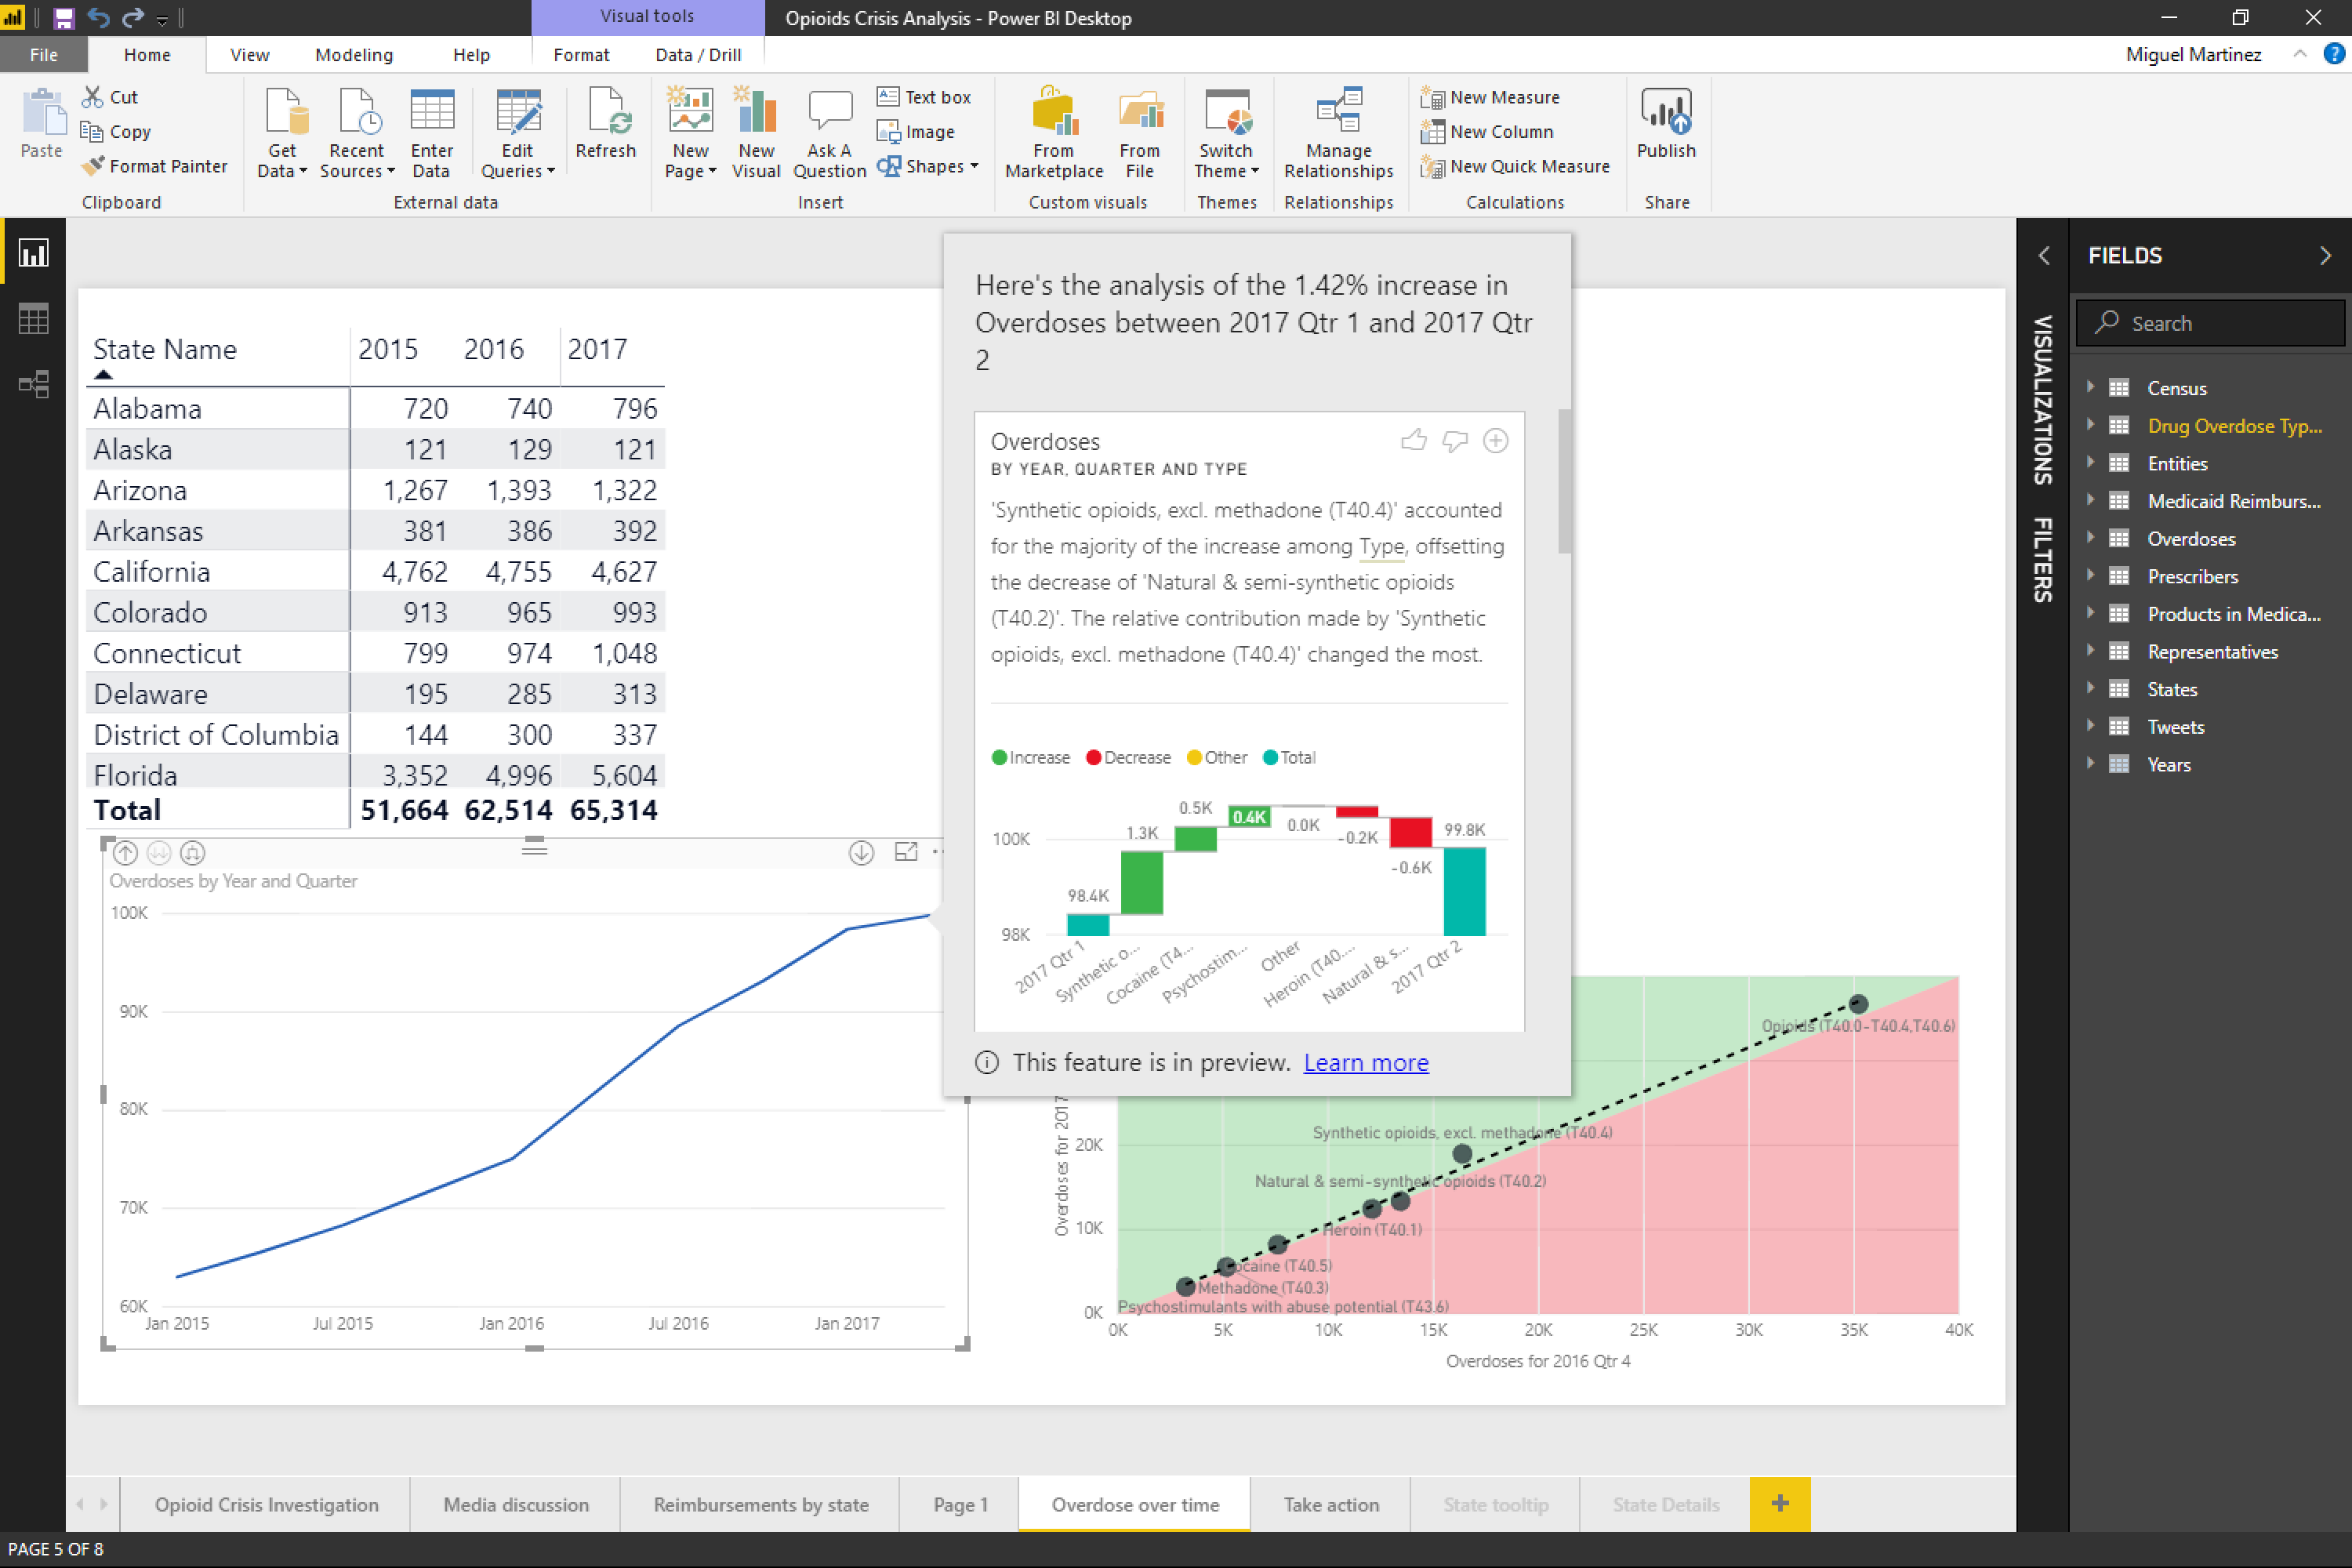
Microsoft Power BI refers to a unified, scalable platform for self-service and business intelligence, which is primarily aimed at corporations. With the help of the tool, the gap between data and decision-making should be closed. With
you can connect to any data from your company, and model and visualize it. Microsoft Power BIFrom these BI deployments you gain insights, based on which you can make decisions with confidence. The software is provided in the cloud, so you can easily share and collaborate reports. There's also a free mobile Power BI app for Android, iOS and Windows Mobile.
Microsoft Power BI Features
These are the main features of Microsoft Power BI:
Access to data from various on-premises and cloud sources:
- The data can be imported and automatically updated from Dynamics 365, Salesforce, Azure SQL DB, Excel, or SharePoint, so you are always up to date.Prepare and model data:
- With the data modeling tools of Microsoft Power BI you can save time and simplify data preparation. The Power BI tool captures, transforms, integrates and extends your data.Advanced analytics:
- With features like Quickmeasures, groupings, forecasts and clustering, you can analyze your data and derive concrete insights. As advanced users, you get complete control over your model with the DAX formula language.Insights from data through AI-driven advanced analytics:
- With the help of the BI tool, you can evaluate data, detect patterns automatically, grasp meaning and predict future results. Programming knowledge for Microsoft Power BI is not required.Interactive, business-customized reports:
- The software offers you the option to create interactive data visualizations. Tools for design, formatting and layout are provided.Document creation from any location:
- The tool is optimized for mobile devices and can be used on the go from anywhere. Reports can be published in the desktop on-premises or in the cloud.Microsoft Power BI Costs
Microsoft Power BI is available in two different price packages
: Power BI Pro and Power BI Premium. The price for Power BI Pro is €8.40 per user per month. Power BI Premium costs €16.90 per month per user. Power BI Premium can also be purchased per capacity. The cost of a capacity is €4,212.30 per month.Microsoft Power BI Alternatives
You are looking for an
alternative to Microsoft Power BI and can't decide which tool best suits your needs? Then check out OMR Reviews! There you can find a large selection of BI tools and choose a suitable tool for you based on real user reviews.3. LookerStudio
is a software for managing and visualizing mass data. With this tool, all data from the other Google tools can be collected and analyzed. The data from Google Analytics, Google Ads, sheets and other Google tools can than be processed with Looker Studio so that metrics, reports and visualizations, evaluations can be created.
Looker StudioLookerStudio Features
No basic fee for the use of Looker Studio.
- Ability to use data from over 800 different sources and other tools.
- Direct access to data from other Google products like Google Analytics, Google Search Console or Google Ads.
- Provides a variety of options for customizing dashboards and reports, including design and branding options.
- Enables the creation of interactive reports, where end users can adjust certain data views and periods.
- Provides nearly real-time queries of the integrated data sources.
- Sharing and joint editing of reports and dashboards.
- Access to an active community and a variety of templates and example dashboards.
- Provides customized data protection measures and requires the deposit of necessary information and consents in the tool.
- LookerStudio Prices
Also for LookerStudio there are no prices available on the website. If you are interested in the business intelligence tool, you can request an offer via the website.
LookerStudio Alternatives
You are looking for an alternative to LookerStudio
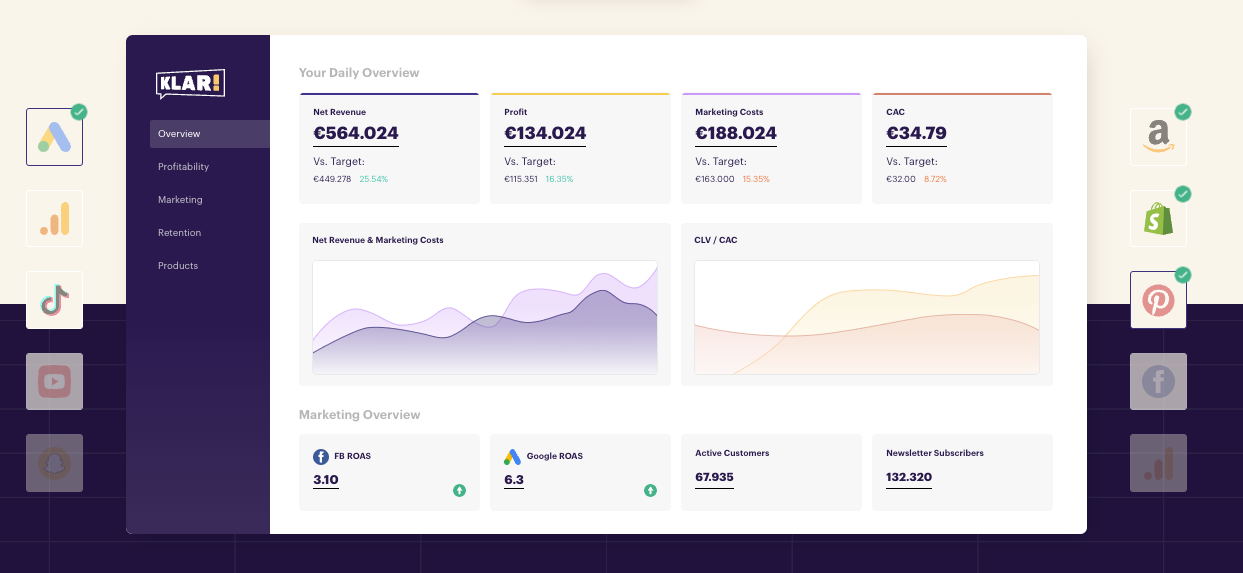
and can't decide which tool best suits your requirements? Then check out OMR Reviews! There you can find a large selection of BI tools and choose a suitable tool for you based on real user reviews.4. ClearlyClear is a business intelligence software solution that provides you with instant access to various reports such as CLV, cohorts or profitability.
is designed for e-commerce businesses with 10 to 100 employees who need to sell multiple products and retain their customers in order to make a profit. Users receive all insights from different data sources they need for their growth – centralized and easily customizable to reflect reality.
Clearly Features KlarClear centralizes all data in one place and creates reports that support company growth. The following reports can be found with the software:
Revenue Reports
Profitability reports
- Retention Report
- User Journey Reports
- Product Reports
- Marketing Reports
- Plain Costs
- The
prices of clear
are based on the annual turnover of your company and start at €200 per month. You can also test clearly for 14 days for free via the provider's website before you have to decide for a pay version.Clearly AlternativesYou are looking for an alternative to clear
and can't decide which tool best suits your requirements? Then check out OMR Reviews! There you can find a large selection of BI tools and choose a suitable tool for you based on real user reviews.
5. TableauThe BI tool Tableau Desktop of the visual analytics platform promises actionable insights and visual live analytics for unlimited data exploration. With the tool, you can connect to local data and data in the cloud and identify trends, recognize opportunities and make viable data-driven decisions on this basis.
You can collaborate with your team members at any time, ask your own questions and build live stories that can be discovered by others. Tableau can extract large amounts of data and, using modern database and computer graphics technology, vast data sets can also be analyzed on your laptop.
Tableau Features TableauThese are the main features of the BI tool Tableau Desktop:
Fast gleaning of actionable insights:
With the business intelligence tool Tableau, diagram creation programs are a thing of the past. Tableau provides you with interactive dashboards to make hidden insights visible in no time. How you can visualize your data from SAP with Tableau simply, you can read in this post about
self-service BI with Tableau and SAP
- .Connection to more data: Whether big data, SQL databases, spreadsheets or cloud applications like Google Analytics or Salesforce - With Tableau you can connect to any data sources. With the help of the tool, you can access the different data and combine them without having to write your own lines of code yourself. In addition, power users have the option to pivot, split and manage metadata in order to optimize data sources.Answering in-depth questions:
- With the software, you can create powerful calculations from existing data, add reference lines and forecasts by drop & drop and use statistical summaries. The business intelligence tool also covers trend analyses, regressions and correlations.Data visualizations on interactive maps:
- Tableau can automatically create interactive maps for over 50 countries - zip codes are integrated. These include, for example, also custom geocodes and territories for personalized regions, such as sales territories.Tableau Costs
- The price for the license Tableau Creator
of the business intelligence tool is $70 per user per month. The costs for Tableau Explorer, an explorer license for Tableau Server, are $42 per user per month. The tool also offers a pure viewer license, Tableau Viewer, for $15 per month per user. There are also some add-ons that can be booked additionally. You can also try Tableau for 14 days for free.
Tableau AlternativesYou are looking for an alternative to Tableau
and can't decide which tool best suits your needs? Then check out OMR Reviews! There you can find a large selection of BI tools and choose a suitable tool for you based on real user reviews.
Alternatively, you can also find a comparison of Tableau with Microsoft Power BI in the following post.
6. MinuboMinubo describes itself as BI (Business Intelligence) for trade. The software aims to help trading companies make data-driven decisions and thus tap into full potential. With all business areas should be able to make better decisions - from management to the operative. The business intelligence solution offers a complete BI stack with a comprehensive tool set, a tablet app for your data-driven POS as well as a broad portfolio of advice and services.
In addition, the software also enables intuitive data access, so that all employees can independently access the data. On- and offline data sources can be summarized to realize a holistic business view. The advanced cloud technology and the pre-made DWH enable a high-performance data processing.
Minubo Functions minuboThese are the key features of Minubo:
Application Suite:
The Application Suite of Minubo is a comprehensive web-based tool set that aims to help your company establish a better, data-driven decision culture and intelligent, automated processes. The Application Suite provides a wide range of tools for all roles and use cases. In addition, the suite includes a customizable Feed API for visualization and process automation via third-party systems, and a plugin builder that realizes the development of your own tools based on the Minubo analytics database.
Store Monitor:
- Minubo's Store Monitor is a tablet app designed to bring data-driven decisions into your stores. Each employee gets access to relevant data and should be able to make better decisions about product promotions and reorders based on them, get transparency about brand, category, and product performance, and easily gain insight into inventory by scanning product barcodes. This is intended to reinforce the efficiency and customer loyalty of your company.Analytics Database:
- The solution for business intelligence also provides an analytics database based on elasticsearch, a particularly fast search engine technology. The database ensures that the BI tool can offer a wide variety of data tools, and at the same time allow you to flexibly use the data from Minubo in third-party systems.Best practice data model:
- The analytics database also includes an integrated commerce data model, which is based on the tool's best practices. The insights and built-in logics are intended to save users of the software time in particular.ETL Process:
- ETL stands for Extract, Transform and Load and describes the path of data from the source system integrations to the analytics database. Minubo's ETL process is built in Apache Spark, an analytics engine for big data processing that guarantees high performance and efficiency and above all full scalability.Smart Workers Unit:
- The Smart Workers Unit of the business intelligence software covers the calculation logics and the built-in intelligence of the tool. The unit generates, for example, alerts and action recommendations and enables the scheduled e-mail dispatch of dashboards and reports.Minubo costs
- The software Minubo is available in three different price packages
. Which price package is right for you depends on your GMV (Gross Merchandise Value/Volume), processed data volume, and the number of interfaces needed. The price package 'For Growth Stars' starts at a price of €690 per month, while 'For Established Players' starts at €1,290 per month. If you want to test the business intelligence tool, you can request a demo version via the website.
Minubo AlternativesYou are looking for a Alternative to Minubo
and can't decide which tool best suits your requirements? Then check out OMR Reviews! There you can find a large selection of BI tools and can select a suitable tool for you based on real user reviews.
These are the main features of Looker:
lookerData Platform:
With the data platform, you can create dynamic dashboards for more in-depth analysis. The Looker platform works seamlessly with your existing BI setup. With the BI tool, you can optimize your workflows and provide data for any application with APIs, SDKs, rule-based proactive alerts, scheduled reports, and built-in analytics.
Data Modeling:
- The business intelligence tool offers data modeling in three steps: First, you connect Looker to any database that supports SQL queries and automatically generate a basic LookML model. In the second step, you can collaborate with your team to build on your own model, or use one of Loooker's pre-made LookML modeling patterns to speed up development. In the third step, you customize your model to the individual metrics of your company, and centrally update and manage your reports in the tool.Looker Blocks:
- Looker Blocks refer to so-called Building Blocks - predefined codes that you can use to accelerate your analysis. These range from optimized SQL patterns to fully formed data models, custom visualizations, and weather and demographic data.Data Connections:
- With Looker's data connections, you can invest in creating impressive analysis. The business intelligence software takes care of managing ETL and databases for you.Looker Costs
- Also for looker there are no prices available on the website. If you are interested in the business intelligence tool, you can request an offer via the website. Also a demo is available if you want to get a better overview of the BI solution.Looker Alternatives
You are looking for a business intelligence tool alternative to Looker Business Intelligence and can't decide which tool best suits your needs? Then check out OMR Reviews! There you can find a large selection of BI tools and choose a suitable tool for you based on real user reviews.
Further Business Intelligence tools on OMR Reviews
You can find and compare more
software and tools for business intelligence
on OMR Reviews. In total, we have listed over 20 BI tools there, with which you can visualize and understand your data. So stop by and compare the software using authentic and verified user reviews.
Conclusion: How to find the best BI tools! In today's data-driven business world, Business Intelligence (BI) tools are not just an option, but a necessity. They enable companies to efficiently capture, process, and gain crucial insights from large amounts of data. From collecting various data sources to automated data analysis and visualization – BI tools transform raw data into valuable business insights that facilitate strategic decision-making.However, choosing the right BI tool can be challenging. Each tool offers specific features optimized for specific business requirements. Whether you need interactive dashboards, plan complex data modeling, or simply want to get a better overview of your operational data, it is crucial that the selected BI tool harmonizes with your business strategy and technical infrastructure.
Therefore, invest in a solution that is not only compatible with a wide range of data sources, but also designs the visualization and data analysis seamlessly and user-friendly. In doing so, you give your company a clear advantage in the fast-paced business world by making data-driven decisions faster and more informed. Remember: The best business intelligence solution is the one that seamlessly integrates into your existing processes and complements them with powerful, automated features.
In der heutigen datengetriebenen Geschäftswelt sind Business Intelligence (BI)-Tools nicht mehr nur eine Option, sondern eine Notwendigkeit. Sie ermöglichen es Unternehmen, große Datenmengen effizient zu erfassen, zu verarbeiten und daraus entscheidende Einblicke zu gewinnen. Von der Sammlung verschiedener Datenquellen bis hin zur automatisierten Datenanalyse und Visualisierung – BI-Tools transformieren rohe Daten in wertvolle Geschäftseinblicke, die strategische Entscheidungen erleichtern.
Die Auswahl des richtigen BI-Tools kann jedoch herausfordernd sein. Jedes Tool bietet spezifische Funktionen, die für bestimmte Geschäftsanforderungen optimiert sind. Ob du interaktive Dashboards benötigst, komplexe Datenmodellierungen vorhast oder einfach nur einen besseren Überblick über deine operativen Daten gewinnen möchtest, es ist entscheidend, dass das ausgewählte BI-Tool mit deiner Unternehmensstrategie und technischen Infrastruktur harmoniert.
Investiere daher in eine Lösung, die nicht nur mit einer breiten Palette an Datenquellen kompatibel ist, sondern auch die Visualisierung und Datenanalyse nahtlos und benutzerfreundlich gestaltet. So sicherst du deinem Unternehmen einen klaren Vorteil in der schnelllebigen Geschäftswelt, indem du datengetriebene Entscheidungen schneller und fundierter treffen kannst. Denke daran: Die beste Business Intelligence-Lösung ist die, die sich nahtlos in deine bestehenden Prozesse einfügt und sie durch leistungsstarke, automatisierte Funktionen ergänzt.
 Tracify
 Microsoft Power BI
 Tableau
 minubo
 Klar
Klar looker
 Looker Studio




 SAP Analytics Cloud
 Y42
Y42 Vertex AI Workbench (vorher Google Cloud Datalab)
 SAP BusinessObjects BI
 Qlik Sense®


