Table of contents
- 6 criteria for choosing a tool for your self-service BI strategy
- #1 Licensing costs
- #4 Data connection and transformation
- Conclusion
Tableau or Microsoft Power BI - which of the self-service BI tools is better suited for my company? We are confronted with this question quite often within the scope of customer projects. Both Power BI and Tableau are part of our technology portfolio in the BI field. For this reason, we are aware that there is no universally valid answer to this question. The decisive factors are the individual requirements and the concrete context for the application of the solution in the company.
In this article, we offer you a first comparison of
Tableau and
Microsoft Power BI and go into the respective strengths. With this, we want to give you a first small decision-making aid.
#1 Licensing costs
For most companies, the licensing costs are a key criterion when choosing a self-service BI tool. The licensing models of Tableau and Power BI fundamentally differ, making a direct comparison difficult.
Tableau offers three different license levels. This is to meet the different data needs of the employees of a company. As a Viewer ($15 per user/month), only access to dashboards that have been published in the Tableau Cloud web application is possible. As an Explorer ($42 per user/month), full access to published dashboards and data sources is possible. Additionally, own workbooks can be created in the web environment. As a Creator ($70 per month), access to all development tools, including Tableau Desktop and Tableau Prep, is additionally possible. The stated license costs refer to provisioning via Tableau Cloud. Provisioning via Tableau Server may involve differing licensing costs. The mentioned license levels can be combined as desired, allowing for a solution specifically tailored to each company.
The developer tool Power BI Desktop - is available for free with the Power BI Free license. The online application Power BI Service is also available free of charge - with the restriction that the sharing function cannot be used. To be able to share reports, a Power BI Pro license is needed for $9.99 per user/month. The full range of Power BI features is finally provided with Power BI Premium, where you can choose between a single user license subscription for $20 per user/month or a fixed price from $4,995 per month. The mentioned license levels can also be combined as desired with Power BI.
Since Power BI Desktop is available for free and the
Power BI Pro license seems very cheap, the initial impression might be that Power BI is unbeatable in terms of licensing costs. However, there may actually be scenarios where Power BI's license costs exceed those of Tableau. In our whitepaper, we provide you with a detailed comparison of the license costs of both self-service
BI tools based on various scenarios.
#2 User-friendliness
Both Tableau and Power BI are market leaders in the field of self-service BI tools. Especially in this field, ease of use and high user-friendliness of the application are key criteria.
Tableau and
Microsoft Power BI both offer the possibility to interact via drag-and-drop. In addition, menus and functions are clearly structured and visually appealing, which suggests very good user-friendliness. For guided navigation, navigation paths in the respective context can also be called up via a right-click. Both self-service BI tools allow for a strongly increasing learning curve initially. Due to the familiar MS Office interface, however, the learning curve with Power BI is initially steeper than with Tableau. With increasing use of more advanced functions, such as in the context of proprietary expression languages, a strong flattening of the learning curve can be expected with both tools.
#3 Ecosystem
With its in-house offerings, especially MS Office, SQL Server, and Azure, Microsoft appears to far outpace Tableau in terms of ecosystem at first glance. Power BI is also part of Microsoft's relatively young
Power Platform, which gives users the ability to create their own apps, automated workflows, and chatbots in addition to data analysis with Power BI, which seamlessly interact with Power BI. However, Tableau is closing the gap. Especially as a result of the acquisition by Salesforce, a powerful partner has been added. The first results of this collaboration are already evident with Einstein Discovery. With Einstein Discovery, a connection to a Salesforce account is enabled. This gives access to all features of the Einstein Analytics platform – for example, the use of additional data sources or the simplified creation of model-driven predictions.
Do you want to learn more about Salesforce's services? You can find all tools and useful articles on the products on
our Salesforce company overview page.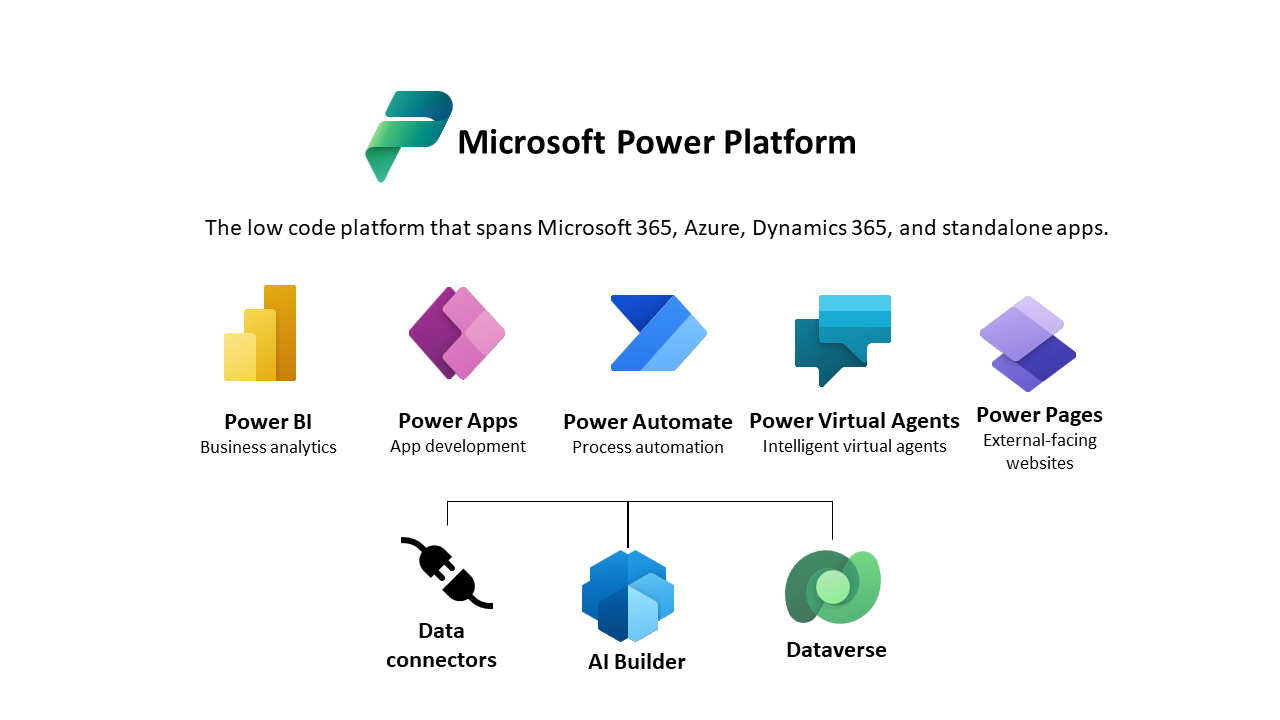
Before data can be visualized and analyzed using the self-service BI tool, it needs to be connected in a preparatory step. Both Tableau and Power BI offer interfaces to the most common data sources in companies. File-based, on-premise, and cloud data sources are supported. Also, the connection of numerous other data sources, such as in the form of R and Python scripts, is possible. Both tools also offer various connectivity variants. With a live connection, the data is queried directly from the preliminary system at runtime. With the import variant, however, a copy of the data from the preliminary system is initially stored within the platform's own data engine.
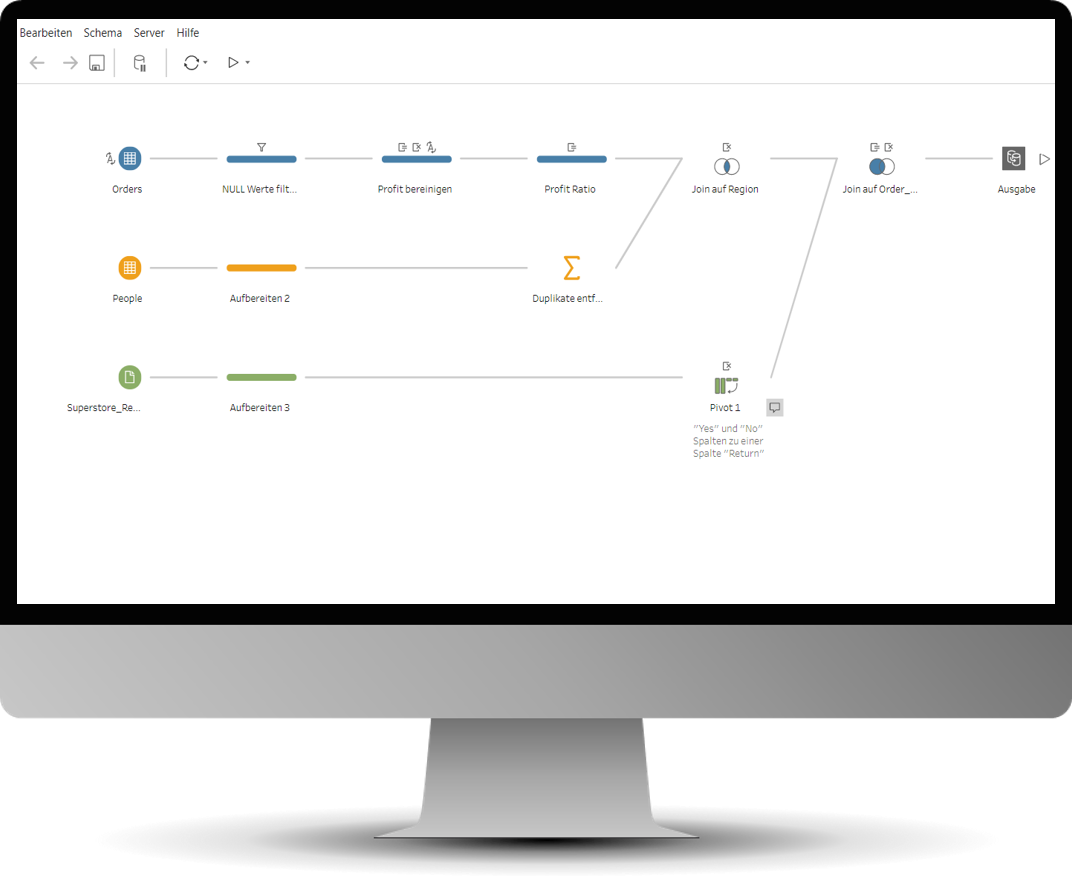
Tableau Prep Builder
Often, various transformations are required as an additional preparatory step to convert the data into a format suitable for visualizations. In Power BI, such transformations can be performed with the Power Query Editor. This is part of Power BI Desktop. Tableau, on the other hand, has a separate tool called the Tableau Prep Builder for data transformations. However, data type adjustments, joins, and other simple transformation steps can also be done with Tableau Desktop. With both self-service BI tools, a wide range of transformation steps can be performed using provided functions within the interface according to the low-code approach, without having to write code expressions. With the M and DAX languages, Power BI provides languages for more complex transformations. Tableau also offers its own expression language for this. To assist users with data cleansing, harmonization, and modeling, both BI tools offer certain standard functions. However, a certain level of database and programming knowledge is required for both BI tools in order to carry out comprehensive transformation processes.
#5 Data visualization and analysis
The options for data visualization and analysis are considered the core functionality of both self-service BI tools.
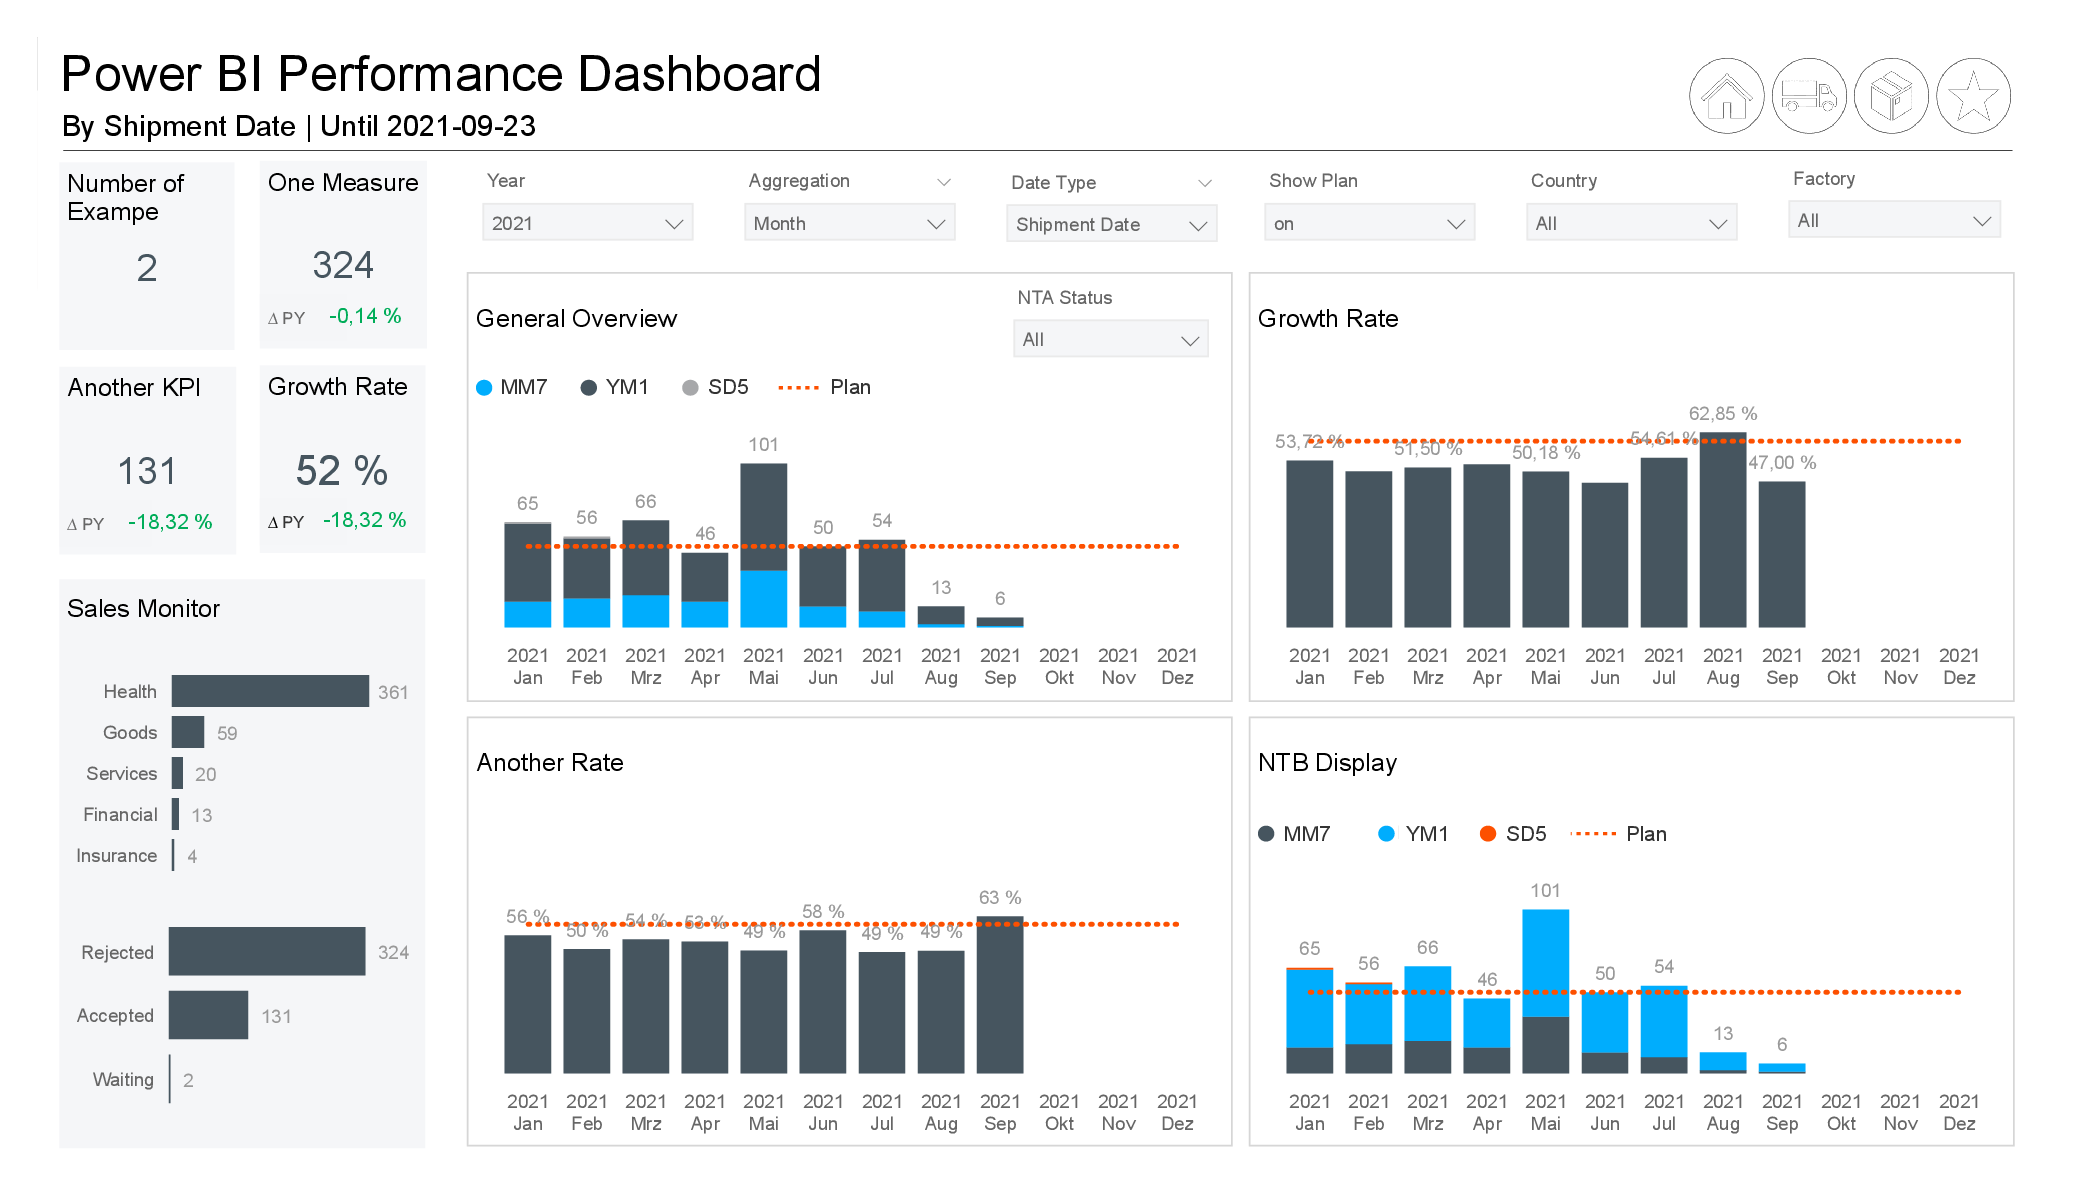
Screenshot from Power BIThe analyses based on a published data set can be carried out both directly in the Power BI Service or Tableau Cloud/Server web application and locally on the user's computer with Power BI Desktop or Tableau Desktop. Power BI and Tableau offer socalled Auto-Charting functions, which assist the user in creating visualizations. With these functions, visualizations can be automatically created based on the selected KPIs and dimensions. Often, however, these need to be adjusted afterwards to maintain clarity and ensure added value. A novice user may find the manual creation of visualizations easier with Power BI. Power BI provides clearly named containers tailored to the different types of visualization, which can be filled with the KPIs and dimensions via drag-and-drop. In contrast, the containers in Tableau remain the same for each visualization. This makes it less intuitive to classify fields for visualization types such as Treemaps. However, Tableau offers a great deal of flexibility within a visualization. It is possible to present a large number of KPIs and dimensions within a visualization in a clear manner.
In summary, it seems likely that Power BI makes it easier to conduct visual analyses, while Tableau is better suited for exploratory data analyses.
#6 Publishing and Collaboration
Functions for publishing and sharing dashboards and analyses are essential, alongside collaboration capabilities, to ensure the efficiency of the self-service BI solution.
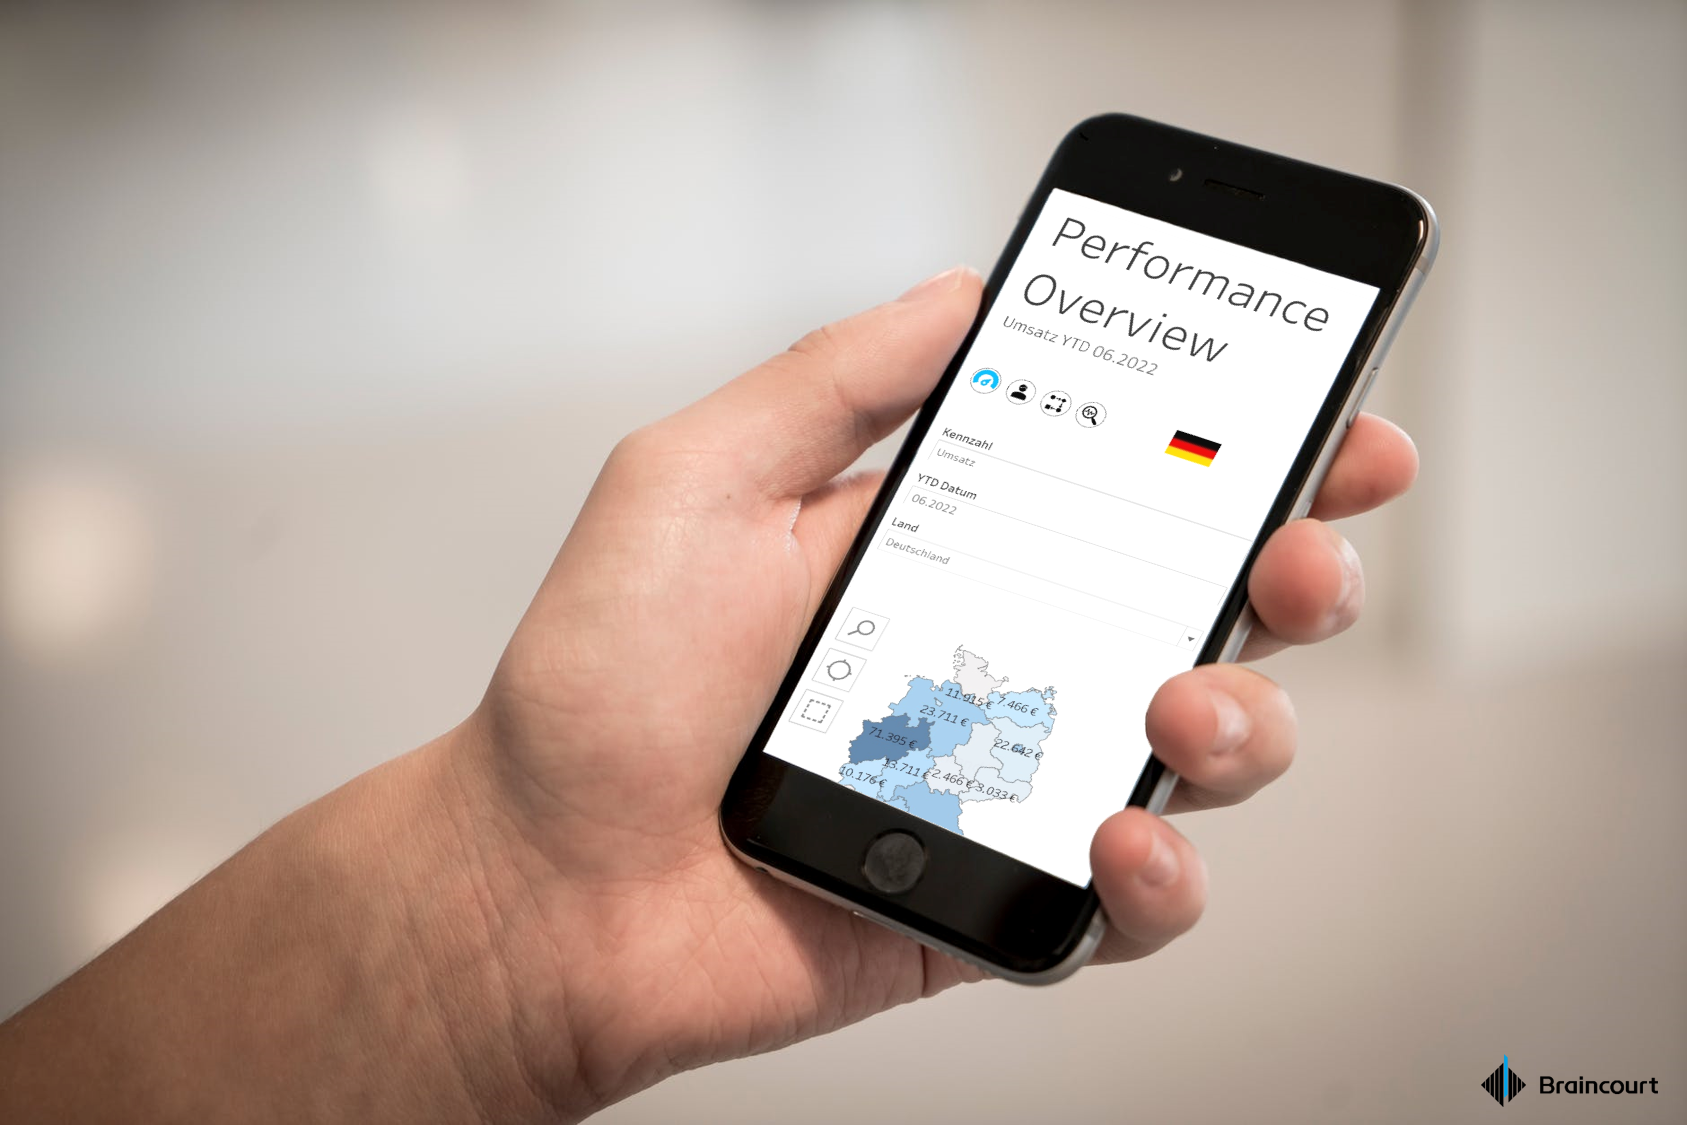
A report can be shared with other users in the company by publishing the workbook from Power BI Desktop or Tableau Desktop via Power BI Service or Tableau Cloud/Server. With Tableau, individual contents from a workbook can also be published. The release can then be carried out in various ways from Power BI Service or Tableau Cloud/Server. It is possible to share visualizations both with individual users and with user groups. In addition, it is also possible to share a dashboard via link in an email, directly embed content on a website, or access it via smartphone (image). Tableau also offers the option to allow external recipients to access dashboards via link on the public Tableau Public platform. These recipients then do not need a Tableau account for access. With both
BI tools, it is also possible to subscribe to dashboards for regular content updates via email. Both Tableau Cloud/Server and Power BI Service allow users to exchange views on dashboards and analyses via a comment function. In addition, Tableau Cloud/Server offers a screenshot function. This allows snapshots of filtered visualizations to be used within the comments.
In essence, the approaches to publication and collaboration between Power BI and Tableau are not different. However, Tableau manages to impress with both the simple possibility of distributing dashboards externally and the more extensive commenting options.
Conclusion
The comparison shows that a general statement as to which of the tools wins the race is not possible.
Tableau and
Microsoft Power BI both have many advantages and are on par in almost all areas. On a deeper level of detail, experts together with the specialist departments and users can define clear requirements and thus make a choice between Tableau and Power BI. Taking into account aspects such as existing infrastructure, number of users, budget, data sources and type of visualizations, an individual requirement catalog can be created to provide a well-founded basis for such a decision.

