Table of contents
- Why is the implementation of BI important for businesses?
- What steps are necessary for the implementation of BI?
- How can you ensure that the BI implementation is successful?
- What challenges and risks exist in BI implementation and how can you master them?
- Which providers of BI tools are there on the market and how do you choose the right tool for your company?
- Successful BI implementation in practice
- Conclusion
Everyone needs them, few use them: Data!
The times when data was sold as the "new oil" are already years behind us. Nowadays, no organization can afford to purely rely on gut feeling and daily form when making important decisions. However, companies often lack the knowledge of the right first steps on the way to becoming a data-driven organization.
Our guest author Torben Jaacks explains in this article how successful implementation of business intelligence solutions can help you initiate data-driven decisions and what you should pay attention to.
Why is the implementation of BI important for businesses?
Making the right decisions with the help of data is an integral part of our daily actions. Even if unconscious, we are trained in many situations to actively incorporate data into our decisions: On the way to work, we avoid every traffic jam with the help of Google Maps' traffic data. When choosing what to have for lunch, ratings on Lieferando decide between burger or pasta. And our Apple Watch tells us based on our movement data whether we should go to the sofa or the gym on the way home.
So while this is absolutely learned behavior in private, many business decision-makers still struggle to use data effectively in the business context. As data-driven as the lunch decision may be, gut feeling and subjectivity still dominate important business decisions.
The reasons for this are diverse. Often, however, it is due to a lack of quick transparency of relevant data: If raw data is scattered around in Excel spreadsheets and Google Sheets, so much time has to be spent on manual compilation of reports that the gut has already made a decision in the meantime.
The implementation of BI solutions can counteract this. The basic goal of BI is to convert data (quickly & correctly) into insights to use them for decision making. From the product purchasing to the budget allocation in marketing.
Recommended Business-Intelligence-Tools
You can find more recommended business intelligence tools on our comparison platform OMR Reviews. There we have over 130 BI tools for small and medium-sized enterprises, start-ups and large corporations to help you better understand your data. So take a look and compare the software with the help of authentic and verified user reviews:
What steps are necessary for the implementation of BI?
With the right strategy, the implementation of business intelligence can be successful in every company, regardless of industry or size. A successful implementation is split into the following five steps:
Step 1: Determine "reason why" & goals
Before systems and tools are chosen and it comes to the technical implementation, the "why" behind the implementation of BI should be addressed. So that the final dashboards and reports do not end up gathering dust in a drawer, all potential users should be early onboard and the objectives associated with the implementation should be clearly defined. Basic issues, such as how data analytics should create concrete sense, help with this, for instance:
- What kind of decisions do I currently have to make in my job?
- What information and insights would help me with this?
- Which KPIs am I basing my and my team's success on?
- How often do I need which reports accordingly?
When these questions of the individual departments are answered, a number of potential use cases with real added value for your organization are bound to emerge. This is the perfect starting situation for the next steps.
Step 2: Identify data sources
Procurement wants to get a permanent overview of the stock levels. Online marketing wants to keep an eye on the current campaign figures automatically. And the customer care team wants to obtain customer satisfaction ratings – cross-platform and at any time.
Three requirements, a myriad of different data sources:
ERP system, online shop,
inventory management software,Facebook, Google, TikTok,
CRM system,, Excel tables, you name it...
To get a better idea of things here, the next step should be to identify the necessary data sources and order them according to the prioritization of your use cases. Tip: Definitely check for synergies in the connection of a data source for several use cases – saves time and delivers faster results!
When we're done with this, we now know the relevant use cases and the necessary data sources. In short: we're ready for implementation!
Step 3: Choose tools and implement ELT routes
Regardless of the result at the end of a data project, whether a dashboard, a data-science application, or a reverse-ETL solution – the steps towards it are always the same: (E)xtract, (L)oad, (T)ransform – in short: ELT.
- (E)xtract: First, the unordered raw data is (E)xtracted from the source systems. Modern tools like Fivetran, airbyte or Funnelreduce the time required to a minimum and provide flexibility for the various data sources.
- (L)oad: Next, the data is (L)oaded into a data warehouse like Snowflake, BigQuery: Cloud Data Warehouse, Databricks or Amazon Redshift. This is a system optimized for reading large amounts of data, centralizing all the data that was previously scattered in one location – your future single source of truth.
- (T)ransform: Centrally stored, the so far disordered raw data can be enriched with your individual business logic. In this (T)ransformation step, your specific campaigns are assigned the marketing expenditures. Stock levels are assigned to individual locations. And contribution margins are calculated exactly as your business model requires.
Step 4: Gain insights
If the data is extracted, loaded, and transformed, nothing (unfortunately) has been gained yet. Data only fulfills their purpose when we get to information that helps us make the right decisions. This means for us that the last step is converting numbers into insights.
This is where tools like
Microsoft Power BI or
Tableaucome into play, which offer countless possibilities for visualizing data. A comparison of both tools can be found in the article about
Tableau or Power BI in Comparison. Whether with the help of colorful graphics or simple data tables – each person analyzes in their own way. Therefore, it is all the more important to rely on tools that allow individual design possibilities in self-service.
In addition to visualization in classic dashboards, there are a number of other ways to directly activate the transformed data: From playing them back into relevant marketing channels for automated segmentation of potential buying groups. Over a predictive analysis for future sales volumes. To live-alerting of sensitive processes along the supply chain. Your goals, your use-cases.
Step 5: Empower people & create data culture
Despite best technical prerequisites, 80% of all data projects still fail. A major reason: a lack of data culture due to insufficient enablement of employees to access relevant data and work effectively with it.
Trainings that clarify regarding access and application of the
BI systems are just as important as the technical BI implementation. Without this step, the risk is high that in the search for data, one falls back on good old Excel out of habit.
What helps: Modern visualization tools like
Microsoft Power BI and
Tableauare designed so intuitively that own reports can be created after a few minutes of training. Even without previous knowledge & computer science degree.
How can you ensure that the BI implementation is successful?
If you follow the mentioned five steps, your BI implementation is likely to be very successful. But one critical to success aspect that we have not yet considered: who does what?
To ensure that your BI implementation is successful, it is crucial to put together your project team. It is important to understand that data projects are not exclusively IT projects. In the end, it's about decision-makers receiving information with which they can increase the likelihood of making the right decisions. And these usually come from the business side, less so from the IT side.
This means that you should build a heterogeneous field of project participants early on. These include, for example:
- Project leader: Responsible for managing the project. Often from data-savvy departments like Controlling or E-Commerce.
- Project sponsor: Makes budget negotiations and project legitimacy a lot easier. Usually someone from upper management.
- Business analyst: Responsible for identifying the requirements of different departments and translating them into corresponding data models.
- Data architect: Responsible for developing the technical architecture of the BI solution, including the choice of suitable tools and technologies.
- Data engineer: Responsible for building and orchestrating data pipelines according to the selected tool setup.
Admittedly, this is just theory. What challenges could arise when putting together your team, you will learn in the next paragraph.
What challenges and risks exist in BI implementation and how can you master them?
When you internally start looking for suitable employees for the respective positions, you will probably hit limits soon enough. While it is still easy to find project leaders and sponsors, it gets more difficult with the other roles. Finding new people, unfortunately, does not get easier: Business analysts, data architects, and engineers are currently the most sought-after resources in the job market. This means that it can take months, even years, to find the right people – far too late for your BI implementation.
Therefore, think about which topics you want to cover internally because they create real value for your company and with which the involvement of an external agency is sufficient. Does building data pipelines internally create value for you and your company, or are you more interested in enabling your colleagues to create their own reports? Should an internal person familiarize themselves with available tools along the ELT(V) routes, or is a workshop with external support sufficient?
Once you've worked this out, you can take appropriate shortcuts on your way to successful BI implementation and avoid the risk of missing internal resources by using specialized agencies.
So far we've mentioned several tools along the individual ELT(V) steps. But how do you now find the right setup to fit your requirements?
Well, first you must get clear on: Best-of-Breed or Best-of-Suite? While the best-of-breed approach connects individual tools into a cohesive overall system, behind best-of-suite hides the all-in-one solution of a single provider.
All-in-one solutions can be successfully used especially for standardized data sources, -analyses, and KPI definitions. Especially for start-ups and smaller companies in the
E-Commerce area, tools like
minubo or
Klar are a good solution when it comes to transparency in essential online KPIs.
However, they reach their limits when it comes to the enterprise-wide and/or industry-specific implementation of a BI solution due to potentially a variety of data sources and individual analysis needs. To flexibly meet these requirements as well, a modular best-of-breed ecosystem has established itself as a best practice in the market in recent years - the "Modern Data Stack".
The following picture reveals how such a system, including modular tools, can look:
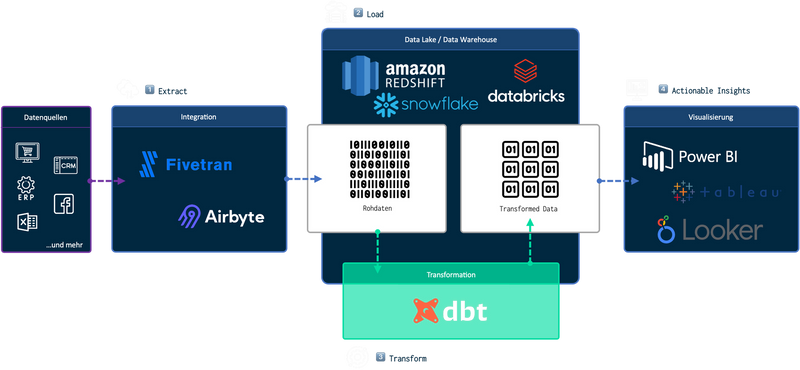
While your first intuition may be that putting together different tools modularly is much more maintenance-intensive: no need to worry! The individual tools in the stack have integrated interfaces, so they work perfectly together and are much more flexible in scaling than all-in-one solutions:
Variable integration tools allow countless data sources to be connected – from established standard APIs to individually programmed in-house solutions. If you need more storage, you can scale with a click in the cloud. And intuitive tools like dbt or
Microsoft Power BI enable users to create their own company-specific reports – without years of computer science studies.
Which tools in the Modern Data Stack fit varies from company to company. If your target analyses are particularly about marketing data,
Fivetran has its strengths. If your existing infrastructure is in the Microsoft world,
Microsoft Power BI may be the right choice. The good thing is: due to the modularity of the stack, the tools can be flexibly adapted and exchanged as requirements grow. For more information on the potential tool stack, you can find
Business Intelligence (BI) Softwares & Tools in Comparison on OMR Reviews.
Successful BI implementation in practice
The project at Haushalt International (HI) is an example of a successful BI implementation. HI is an internationally positioned trading company, which distributes various products in the areas of home, leisure, and garden.
While rudimentary Excel analyses provided transparency in sales in the past, it was becoming increasingly difficult to keep an overview with the increasing number of products and sales. Data that was urgently needed was often only available when it was too late for a decision.
After initial requirement capturing, all necessary ELT routes were set up within a few days and reports with the key figures were created for each department. In addition to the provision of pre-fabricated reports as project lighthouses, decision makers were also enabled to create their own analyses within the new infrastructure– completely without help from IT or consultancy. How successfully HI works today with the results of the BI implementation, you can see here:
Recommended editorial content
At this point you will find external content from YouTube that complements the article. You can display it with one click.
I consent to external content being displayed to me. This allows personal data to be transmitted to third-party platforms. Read more about our privacy policy.
Conclusion
With the right strategy, the introduction of your BI solution will be a complete success. Start by thinking about the meaning and purpose of data analysis in your company and align all subsequent steps of your solution to gain real insights. Rely on modern tools that allow you and your colleagues to create your own reports quickly and flexibly. With the final goal in mind, you are well on your way to more data and less gut feeling.


