Table of contents
- What are heatmaps and what should you use them for
- Tracking user behavior with Google Analytics as an alternative to the Heatmap Tool - An Example
- Tips for successful tracking of user behavior
- Conclusion
The demand from users for digital products and websites is constantly increasing. User experience has long since ceased to be a "nice-to-have", but has become an absolute hygiene factor in the digital world. If you want to be successful online, you must understand your users and provide them with the best possible experience, regardless of whether the goal is a direct purchase, a registration or the consumption of certain content. Good user experience is a long-term revenue driver and can increase the
conversion rate of a website by up to 200%boost.
Data on user behavior (engl. Behavioral Data) supports product and marketing teams when it comes to validating UX, UI and content hypotheses. Also, for the operation of website or
online shop conversion optimization and A/B testing, data on user behavior is necessary. Usage data complements qualitative data from surveys or structured interviews. Because not infrequently, people's actual behavior deviates from what they described or how they acted in an interview situation. Therefore, capturing quantitative data on user behavior (page views, clicks, views, scrolling, timing etc.) is just as important.
The usage behavior of users can be recorded with different tools, e.g. with the existing web analytics tool or a heatmap tool.
What are heatmaps and what should you use them for
Heatmaps are visual representations of data, originally invented for the financial sector by software developer Cormac Kinney in the mid-90s. Heatmaps usually use color gradients to visualize the progression from lowest to highest value. You know them for example from good old Excel when you want to perform conditional formatting or from various dashboard tools that e.g. visualize a metric per country over time.
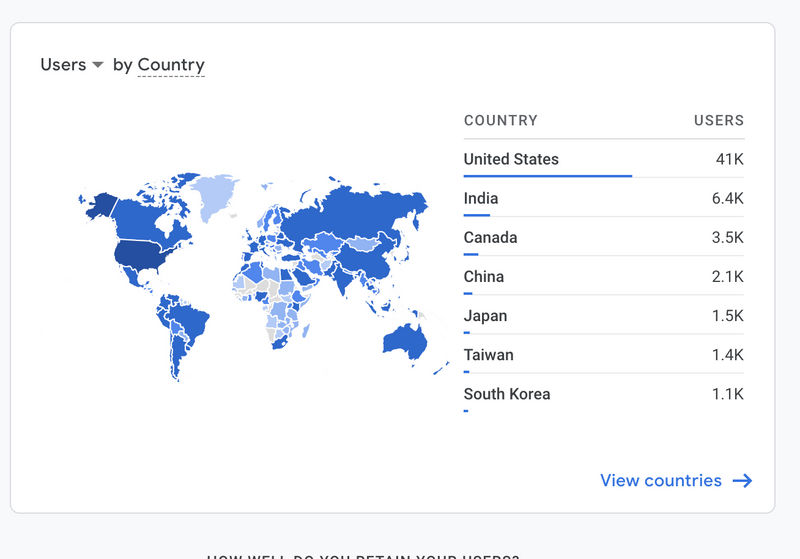
Google Analytics Heatmap
In online marketing, heatmaps are often equated with heatmap tools. That means, a heatmap is usually understood not only as the type of visualization of data, but an integrated tracking tool to be able to trace the behavior of website visitors.
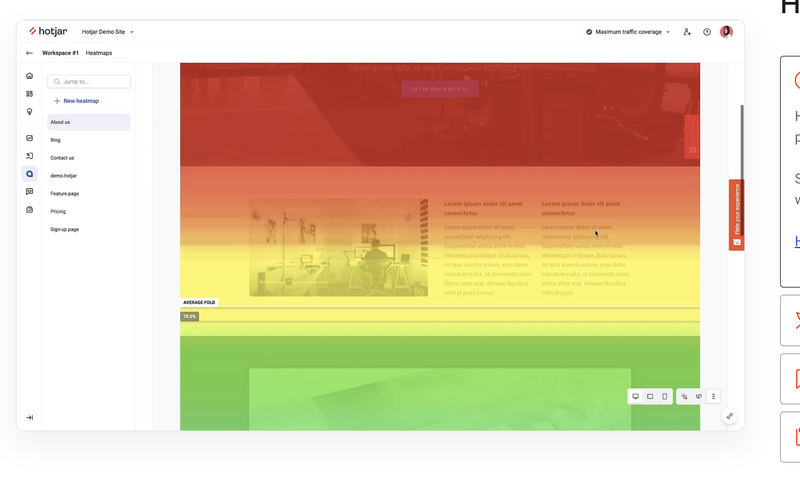
With the help of heatmaps, you can evaluate how people use their mouse or tap on their mobile while using your website. This usage data is then visually prepared appealingly. Different types of heatmaps are e.g.:
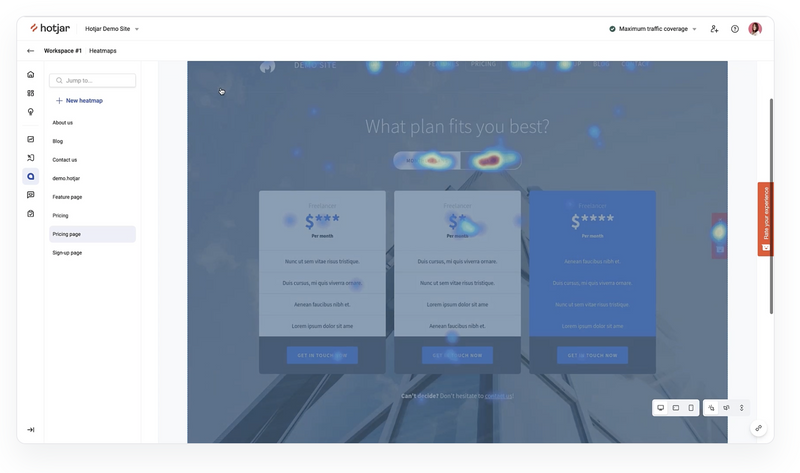
Heatmaps capture user behavior implicitly, which means that a large amount of (click) data is automatically collected after embedding a simple code snippet, without any further implementation effort being necessary.
Technically speaking, heatmap tools build on screenshots of the page. Subsequently, click data is collected and the heatmap overlayed onto the screenshot. This comes with significant limitations. For example, you won't be able to capture dynamic website elements like pop-ups, dropdown menus or lazy-loading contents with heatmap tools.
If you want to learn more about user behavior (clicks, scrolling, visibility, timings etc.) with the help of
Google Analytics, you can just as well go about it. In GA, you can create this database yourself. In contrast to the heatmap tool, this is
explicit tracking, which means you need to explicitly know what you want to measure and implement it in Google Analytics 4. Some interactions may be automatically captured by Google Analytics 4 using the new "Enhanced Measurement". As a rule, however, the data depth is not sufficient, so it is recommended to involve a developer as early as possible. Developers know best about the structure and functionality of your website and can already discuss potential technical challenges. You can proceed as follows.
1. Set goals
First, look at the individual sections of the landing page and their respective goals or benefits. Setting goals and drawing up a tracking plan should be your very first step, even before you
set up Google Analytics in general. A tracking plan is crucially important as central documentation and as a communication medium between developers, analysts and marketing managers. A fantastic side effect of this documentation is the obligation to provide evidence according to the GDPR about which data is collected when, how and why. Your data protection officers will thank you.
A tracking plan is the key to the success of web analytics, as you as a team ask important questions independently of the tools and technologies used such as:
- Why do you want to measure something? What are your hypotheses?
- What are the central metrics with which you can validate your hypotheses?
- What analytics events do you need in order for the metrics to be calculated if necessary?
In many cases, business-critical events such as form inquiries, orders etc. are sufficient for a long time, as long as there is no clear goal behind detailed interaction data, because more data does not automatically have more value. It also goes against current data protection regulations (keyword data economy) to arbitrarily or unintentionally collect data that no one ever looks at.
2. Define questions and analytics events per section
Divide your website into different page types and the pages into individual sections, elements and components, for which you want to track how your users interact with them.
The OMR Reviews homepage, for example, can be divided into the following three content blocks.
Hero Section

OMR Reviews Hero
Questions:
- How do users use the navigation? What is clicked how often?
- How often do users click into the search field?
Analytics Events
- Navigation_click Event, as soon as users click on a menu item in the navigation. (Don't forget the parameter "Category" or "Link Text", so you can evaluate which menu item was clicked on)
- Search_click Event, as soon as users click into the search field
Call-to-Action (CTA)
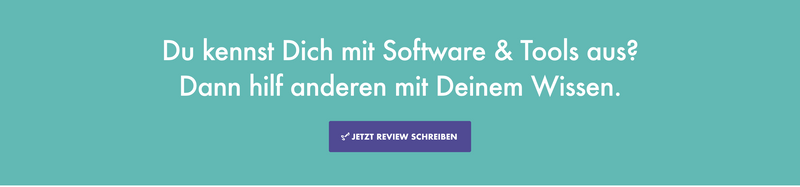
OMR Reviews CTA
Questions:
- How often do users see the CTA section?
- How often do users click on "Write review now"?
Analytics Events:
- CTA_view Event, for example as soon as the CTA is visible to the users in the visible area to 50 % for at least one second.
- CTA_click Event, as soon as users click on the button
Testimonial
OMR Reviews Testimonial
Questions:
- How often do users see the testimonial section?
- Do users who have seen the testimonial write a review more often than users who have not seen the testimonial?
Analytics Events:
- Testimonial_view Event, as soon as the CTA is visible to the users in the visible area to 50 % for at least one second
- The relevance of the question is irrelevant for the principle and of course there are numerous other sections and paragraphs on the website.
Tips for successful tracking of user behavior
Regardless of which tool or approach (implicit or explicit) you choose, there are basic things you should consider when evaluating user behavior on your website.
Formulate questions or hypotheses
Formulate questions that you want to answer with the data and share them within the team. Otherwise you run the risk of randomly tracking all sorts of things and never looking at the numbers. Collecting data that is not used contradicts the zeitgeist of growing privacy movements and stricter legal data protection requirements. "Who knows if we'll ever need it" – approaches are partly justified, but should be discussed once more in the team.
Segment, segment, more segment
The visibility of individual page elements and click or tab behavior can vary greatly with the end device. Segmentation is generally a very powerful tool in web analytics. In the evaluation of user behavior, however, it is also absolutely necessary, especially when it comes to the visibility of individual elements or the scroll behavior. The usage behavior can differ extremely again depending on further segments, e.g. between new and existing customers, different marketing sources, different tests, language settings, light and dark mode ... you name it! The context in which a user is located is heavily associated with how the person interacts on certain pages or with certain features.
Don't overestimate scrolling
Don't give scrolling too much value. How often have you scrolled wildly over a page to "bottom" without reading anything? Or not scrolled at all and still read, e.g. because the text was very short. Scrolling does not have particularly reliable informative value. Of course you can invest time and resources in optimizing the scroll tracking so that it becomes more accurate. However, timings and visibility tracking of website elements often come closer to the truth, with manageable implementation effort.
Measure tool-agnostically
Avoid dependency on a single tool provider when tracking user behavior on your (!) website, whether heatmap or analytics tool. Your requirements are very likely to change over time, be it due to the functionality of your product or legal framework conditions. Instead of looking for the "egg-laying wool milk sow", make sure to separate complete control over data collection from your analytics or dashboard tool. This way you gain ownership over data collection and save yourself recurring implementation effort in the future. There are open source projects like the walker.js as a first-party tracking library for the implementation of a one-time tool-agnostic data collection. This will make your data protection officer happy and you are sustainably well positioned for data-driven product development and optimization.
Conclusion
Anyone who wants to survive and grow digitally today must understand their users and offer them the best possible experiences with their own products. Collecting data on user behavior is an important step towards customer-centric product and brand development.
Heatmap tools are an easy starting point for analyzing user behavior on your website. The data on clicks, scroll depth, and also hover behavior with the mouse can also be captured with a common analytics tool like Google Analytics. Due to stricter data protection requirements, it should be weighed whether the integration of another tool is necessary solely for out-of-the-box heatmap visualizations.
In the end, what counts is that the data obtained is used in the company.
This usually only happens if clear hypotheses are formulated in advance and a tracking plan is created. This should record which questions the team wants to answer and which assumptions are made. Only then should it be decided which tool should be used to collect the necessary data and which form of visualization is meaningful for different stakeholders.
No technology and no tool replaces this conceptual preliminary work. Tracking is not an end in itself: first, when the tracking plan is in place and the goals are formulated, you can decide whether you will reach your goal with a heatmap tool or with Google Analytics.


